International Journal of Agricultural Science and Food Technology
Quality Evaluation of an Oat Wheat Composite Bread Enriched with Rice Bran and Banana Extracts
1Department of Food Science and Technology, School of Engineering and Engineering Technology, Federal University of Technology, Owerri, Imo State, Nigeria
2Department of Agricultural and Bio-resources engineering, School of Engineering and Engineering Technology, Federal University of Technology, Owerri, Imo State, Nigeria
Author and article information
Cite this as
Ofoedum AF, et al. Quality Evaluation of an Oat Wheat Composite Bread Enriched with Rice Bran and Banana Extracts. Int J Agric Sc Food Technol. 2026; 12(2): 13-25. Available from: 10.17352/2455-815X.000232
Copyright License
© 2026 Ofoedum AF, et al. This is an open-access article distributed under the terms of the Creative Commons Attribution License, which permits unrestricted use, distribution, and reproduction in any medium, provided the original author and source are credited.This study focused on the production and quality evaluation of oat wheat composite bread enriched with rice bran and banana extract, with the aim of improving its nutritional, functional, physical, sensory, and storage qualities. Oat flour was incorporated into wheat flour at varying substitution levels and enriched with measured quantities of rice bran and banana extract. Bread samples were produced using the straight dough method, after which the composite breads were subjected to proximate analysis, functional property evaluation of the flour blends, physical assessment of the loaves, mineral and vitamin determination, shelf-life study, and sensory evaluation. The results showed that enrichment with oat flour, rice bran, and banana extract significantly enhanced the nutritional quality of the bread samples. Increases were observed in protein, crude fiber, ash, and mineral content relative to the control (100% wheat bread). Functional properties such as water absorption capacity, bulk density, swelling capacity, and oil absorption capacity improved due to the high fiber and bioactive components of the enriched blends. Physical properties revealed a slight reduction in loaf volume and specific volume with increasing substitution levels; however, the bread samples maintained acceptable structural integrity and baking performance. Sensory evaluation indicated that the enriched breads were generally acceptable, with samples containing moderate levels of enrichment showing the highest preference in terms of taste, aroma, texture, and overall acceptability. Shelf-life analysis further demonstrated better microbial stability in enriched samples, which was attributed to the antioxidant properties present in rice bran and banana extract. Overall, the study established that oat wheat composite bread enriched with rice bran and banana extract offers improved nutritional benefits without compromising consumer acceptability. The utilization of these local and underused raw materials highlighted a sustainable approach to bread production, reduced dependence on imported wheat, and supported the development of functional bakery products with enhanced health value. The findings contributed to the growing body of knowledge on composite flour technology and demonstrate its potential in addressing nutritional needs and promoting food security.
Bread is one of the oldest and most widely consumed staple foods in the world. It is a dietary cornerstone in many cultures, providing essential nutrients such as carbohydrates, proteins, and fiber [1]. The versatility, affordability, and ease of production have made bread a fundamental component of human diets for thousands of years. The origins of bread date back to prehistoric times, with evidence suggesting that early humans made flatbreads from wild grains as early as 14,000 years ago [2]. The development of agriculture during the Neolithic Revolution further solidified bread’s role in human civilization, with ancient Egyptians pioneering leavened bread around 4,000 BCE [3]. Bread is primarily composed of flour, water, yeast, and salt, making it a rich source of carbohydrates. Whole grain breads provide dietary fiber, B vitamins, and minerals such as iron and magnesium [4]. However, refined white bread has been criticized for its lower nutritional content and high glycemic index [5]. Bread holds significant cultural symbolism across societies. In Christianity, bread represents the body of Christ in the Eucharist, while in Judaism, challah bread is used in Sabbath rituals [6]. Economically, bread production and trade have historically influenced global economies, with fluctuations in grain prices impacting food security [7].
Today, bread comes in numerous forms, including sourdough, multigrain, gluten-free, and fortified varieties. The rise of gluten-free bread caters to individuals with celiac disease or gluten intolerance [8]. Despite debates over processed bread’s health effects, it remains a dietary staple due to its convenience and adaptability [9]. Bread remains a staple food worldwide, but conventional wheat bread has limitations in nutritional quality, particularly regarding fiber, micronutrients, and functional bioactive compounds [1]. Recent trends in food science emphasize composite flours and natural fortification to enhance bread’s nutritional profile while maintaining sensory acceptability [10]. Bread is one of the most widely consumed staple foods globally, providing a significant source of carbohydrates, proteins, and essential nutrients [11]. However, conventional wheat bread often lacks sufficient dietary fiber and bioactive compounds, which are essential for promoting digestive health and reducing the risk of chronic diseases such as cardiovascular disorders and diabetes [12]. As a result, there is growing interest in the development of functional bakery products enriched with health-enhancing ingredients.
Nutritional Composition of Bread includes carbohydrates (60%), proteins (15%), fats (5%), fiber (10%), B vitamins, iron & calcium, magnesium & zinc, sodium, water content (45%), fortification & additives. The health benefits of bread include that it serves as a source of energy, it is rich in dietary fiber, it supports heart health, it aids in weight management, it supports blood sugar control, it helps in reducing the risk of chronic diseases, it contains probiotics and prebiotics that support gut microbiota balance and improve digestion [9].
Cereals, belonging to the Gramineae family, are edible seeds or grains cultivated worldwide, with wheat and rice contributing to over half of global grain production [13]. Common cereals include rye, oats, barley, maize, triticale, and millet, with their production influenced by genetic and environmental factors. Structurally, all cereals contain an embryo and a starch-rich endosperm. As staple foods since ancient times, cereals provide essential nutrients, including protein, B vitamins, and minerals, while being cost-effective to grow, store, and transport [14]. Their structure comprises the germ, endosperm, aleurone layer, pericarp, and bran, each playing a vital role in plant development. Additionally, cereal grains and germs are rich in phytochemicals such as phenolic acids, flavonoids, and terpenes, along with essential vitamins (E, B1, B2, B3), minerals (P, K, Mg, Ca, Zn, S), and fiber, making them valuable for functional food production [15].
Wheat, a globally important cereal, is used for various food products and has numerous varieties, while rice, a staple for much of Asia, consists of brown and white types with distinct structural components [14,16], maize, primarily grown in the US, serves as a major starch source with several commercial varieties [17,18], barley, used for animal feed and brewing, is a hardy grain cultivated in various climates [19], oats, produced mainly in cold, wet regions, are used for food and industrial purposes [15], rye, a cold-resistant crop grown in Europe, is mainly used for bread-making and animal feed [20], millet, including pearl millet, is important in Africa and Asia and thrives in dry conditions [21], and sorghum, a heat-tolerant crop, is widely consumed in Africa and Central Eastern Europe [22]. Oats (Avena sativa) have gained attention in functional food development due to their high beta-glucan content, a soluble fiber known for its cholesterol-lowering and heart health benefits [23]. Research has shown that incorporating oat flour into bread formulations can enhance dietary fiber content and improve glycemic response while maintaining acceptable sensory properties [24].
Rice bran, a byproduct of rice milling, is another valuable ingredient for improving the nutritional quality of bread. It is rich in dietary fiber, antioxidants, vitamins (B-complex, vitamin E), and minerals such as iron and magnesium [25]. Studies suggest that rice bran supplementation in bakery products can enhance fiber intake and provide bioactive compounds that promote overall health [26].
Bananas (Musa spp.) are a good source of potassium, antioxidants, and bioactive compounds that contribute to improved metabolic health and oxidative stress reduction [27]. Banana extract can be used as a natural sweetener and flavor enhancer in bread production, potentially improving both nutritional quality and consumer acceptability [28].
Given the nutritional significance of these ingredients, this study aims to develop an oat-wheat bread enriched with rice bran and banana extract and assess its quality attributes, including proximate composition, physical properties, sensory acceptability, and microbial stability. This research will contribute to the growing field of functional food development by providing a healthier bread alternative that meets consumer demand for improved nutritional value. Wheat is not a native crop to Africa, and local production does not meet the growing demand for wheat-based products. Most African countries, including Nigeria, Kenya, and Ghana, import large quantities of wheat annually [10]. The cost of wheat imports places a significant burden on national economies, increasing vulnerability to global market shocks, such as the Russia-Ukraine conflict, which disrupted wheat supplies in 2022 [13]. The main Objective of this study is the production and quality evaluation of oat-wheat Composite bread that has been enriched with rice bran and banana extracts. Therefore, this study will focus on the production and quality evaluation of Oat-Wheat bread that has been enriched with Rice Bran and banana extracts, assessing the nutritional composition and quality evaluation compared to other commercial breads. The Oat-wheat bread will undergo nutritional analysis, examining macronutrient and micronutrient content, functional properties, as well as sensory evaluation, assessing taste, texture, aroma, color, and overall preference to investigate consumer acceptance of the product compared to other bread products.
Materials and methods
Materials
Procurement of Raw Materials: Oat, Wheat, Rice Bran, Banana, Sugar, Salt, Yeast, Water, Milk, Industrial vanilla flavors, milk Flavors, Eggs, Margarine were used for this research work, and it was purchased from a local market (Relief market) in Owerri, Imo State, Nigeria. The grains were carefully selected and processed immediately after purchase to prevent quality degradation and spoilage. The banana was freshly bought and extracted to avoid spoilage.
Equipment Used: The Equipment used for the samples production and analysis was weighing balance, mixing bowls, Measurement cups and spoons, Dough Mixer, baking pans or trays, Gas Oven, Plastic or paper bags, Hot air oven, Desiccators, Muffle furnace, Simple titration setup (burette, pipette, conical flask), Measuring cylinder or seed displacement method, Knife and ruler, Scoring sheets, small room or quiet space, Petri dishes, Sterile cotton swabs etc.
Methods
Materials and Equipment Used: Preparation of Oat flour sample
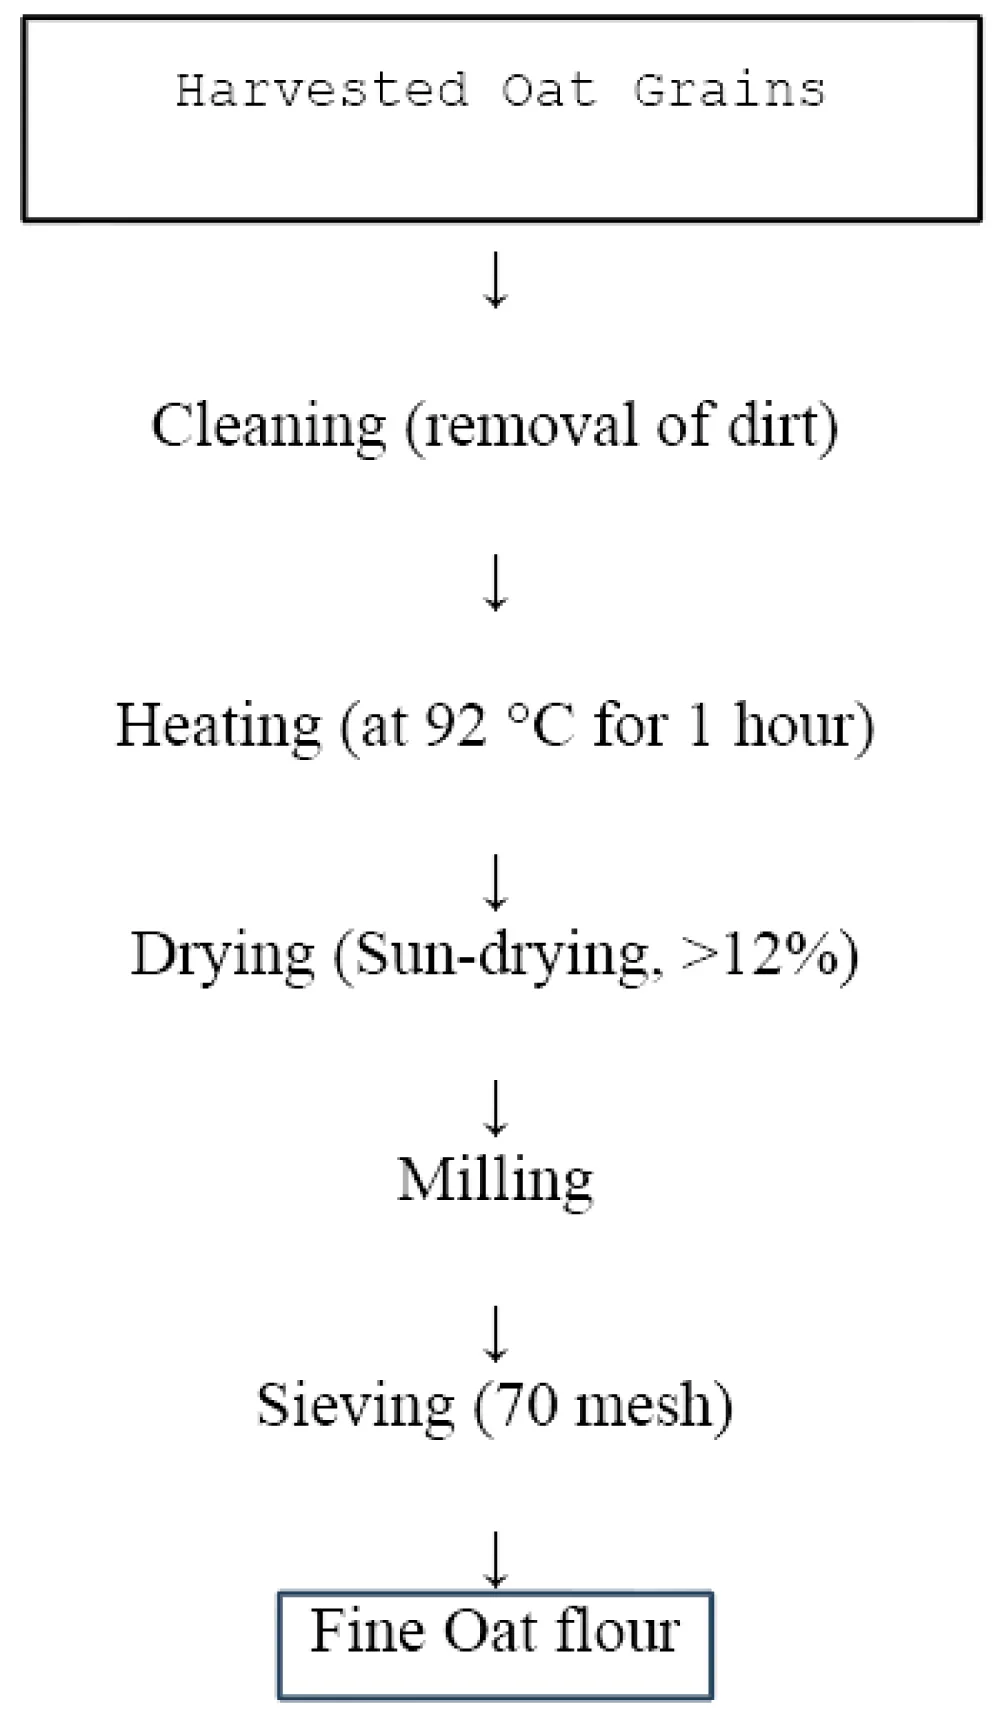
Oat flour was prepared according to the method described by Singh et al. with slight modifications. The oat grains were initially cleaned manually to remove dirt, stones, chaff, and other extraneous materials. The cleaned grains were subjected to heat treatment at 92°C for 1 hour to improve functional properties, reduce microbial load, and enhance processing stability. Thereafter, the heated oats were sun-dried to a moisture content below 12% to facilitate effective milling and prolong storage stability. The dried oat grains were milled into flour using a laboratory milling machine and subsequently sieved through a 70-mesh sieve to obtain fine oat flour with a uniform particle size. The resulting flour was packaged in airtight containers and stored under appropriate conditions until further use (Figure 1).
Preparation of the wheat flour sample
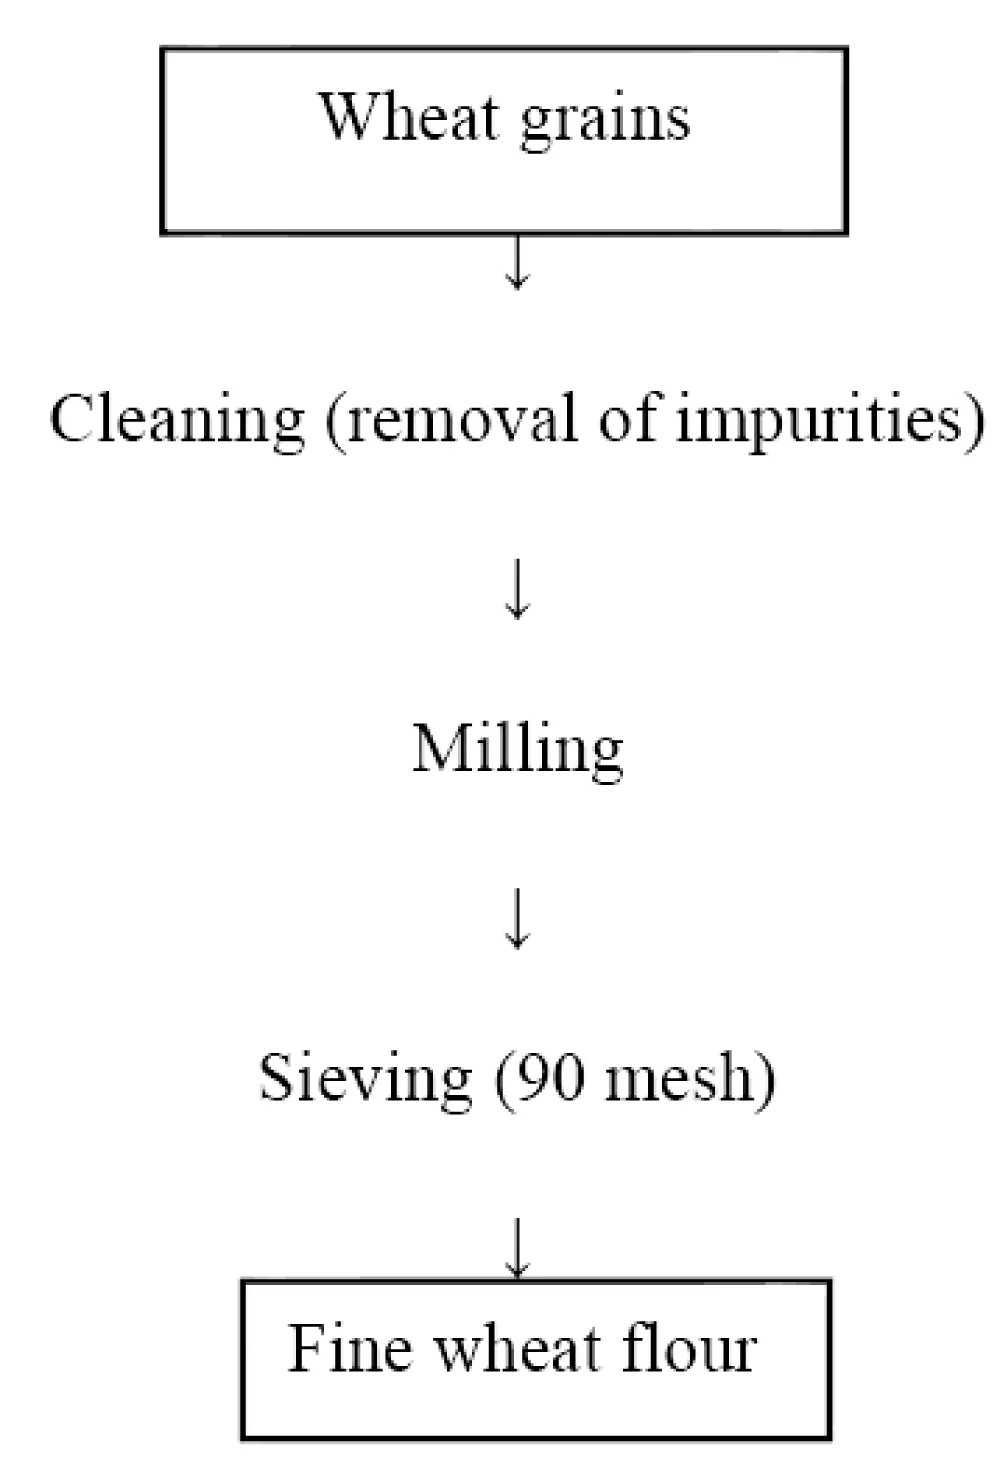
Wheat flour was prepared according to the method described by Kent and Evers with slight modifications. The wheat grains were thoroughly cleaned to remove impurities such as stones, dust, chaff, and other foreign materials that could affect flour quality. The cleaned grains were then milled using a laboratory milling machine to obtain flour. The milled flour was subsequently sieved through a 90-mesh sieve to obtain a fine and uniform particle size suitable for product formulation. The resulting wheat flour was packaged in clean, airtight containers and stored under appropriate conditions until further use (Figure 2).
Preparation of rice bran sample
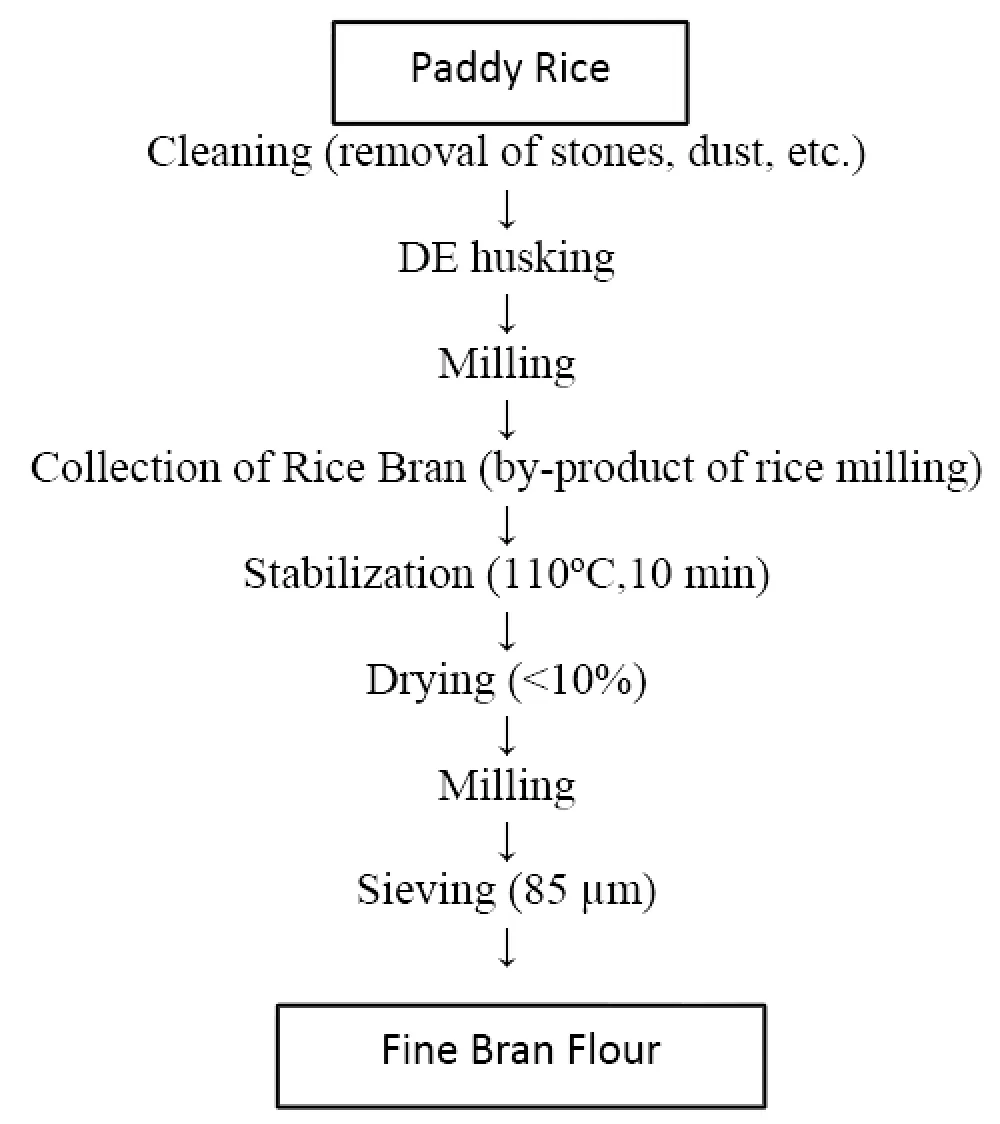
Rice bran flour was prepared according to the methods described by Saunders [29] and Shobana and Malleshi with slight modifications. The rice grains were initially cleaned to remove stones, dust, dirt, and other foreign materials that could interfere with processing quality. The cleaned rice grains were subsequently de-husked to remove the outer husk layer. The de-husked rice was milled, and the rice bran, obtained as a by-product during the milling process, was collected. To prevent rancidity and enzymatic deterioration caused by lipase activity, the collected rice bran was stabilized by heating at 110°C for 10 minutes. The stabilized bran was then dried to a moisture content below 10% to improve shelf stability and facilitate further processing (Figure 3).
Preparation of the banana extract sample
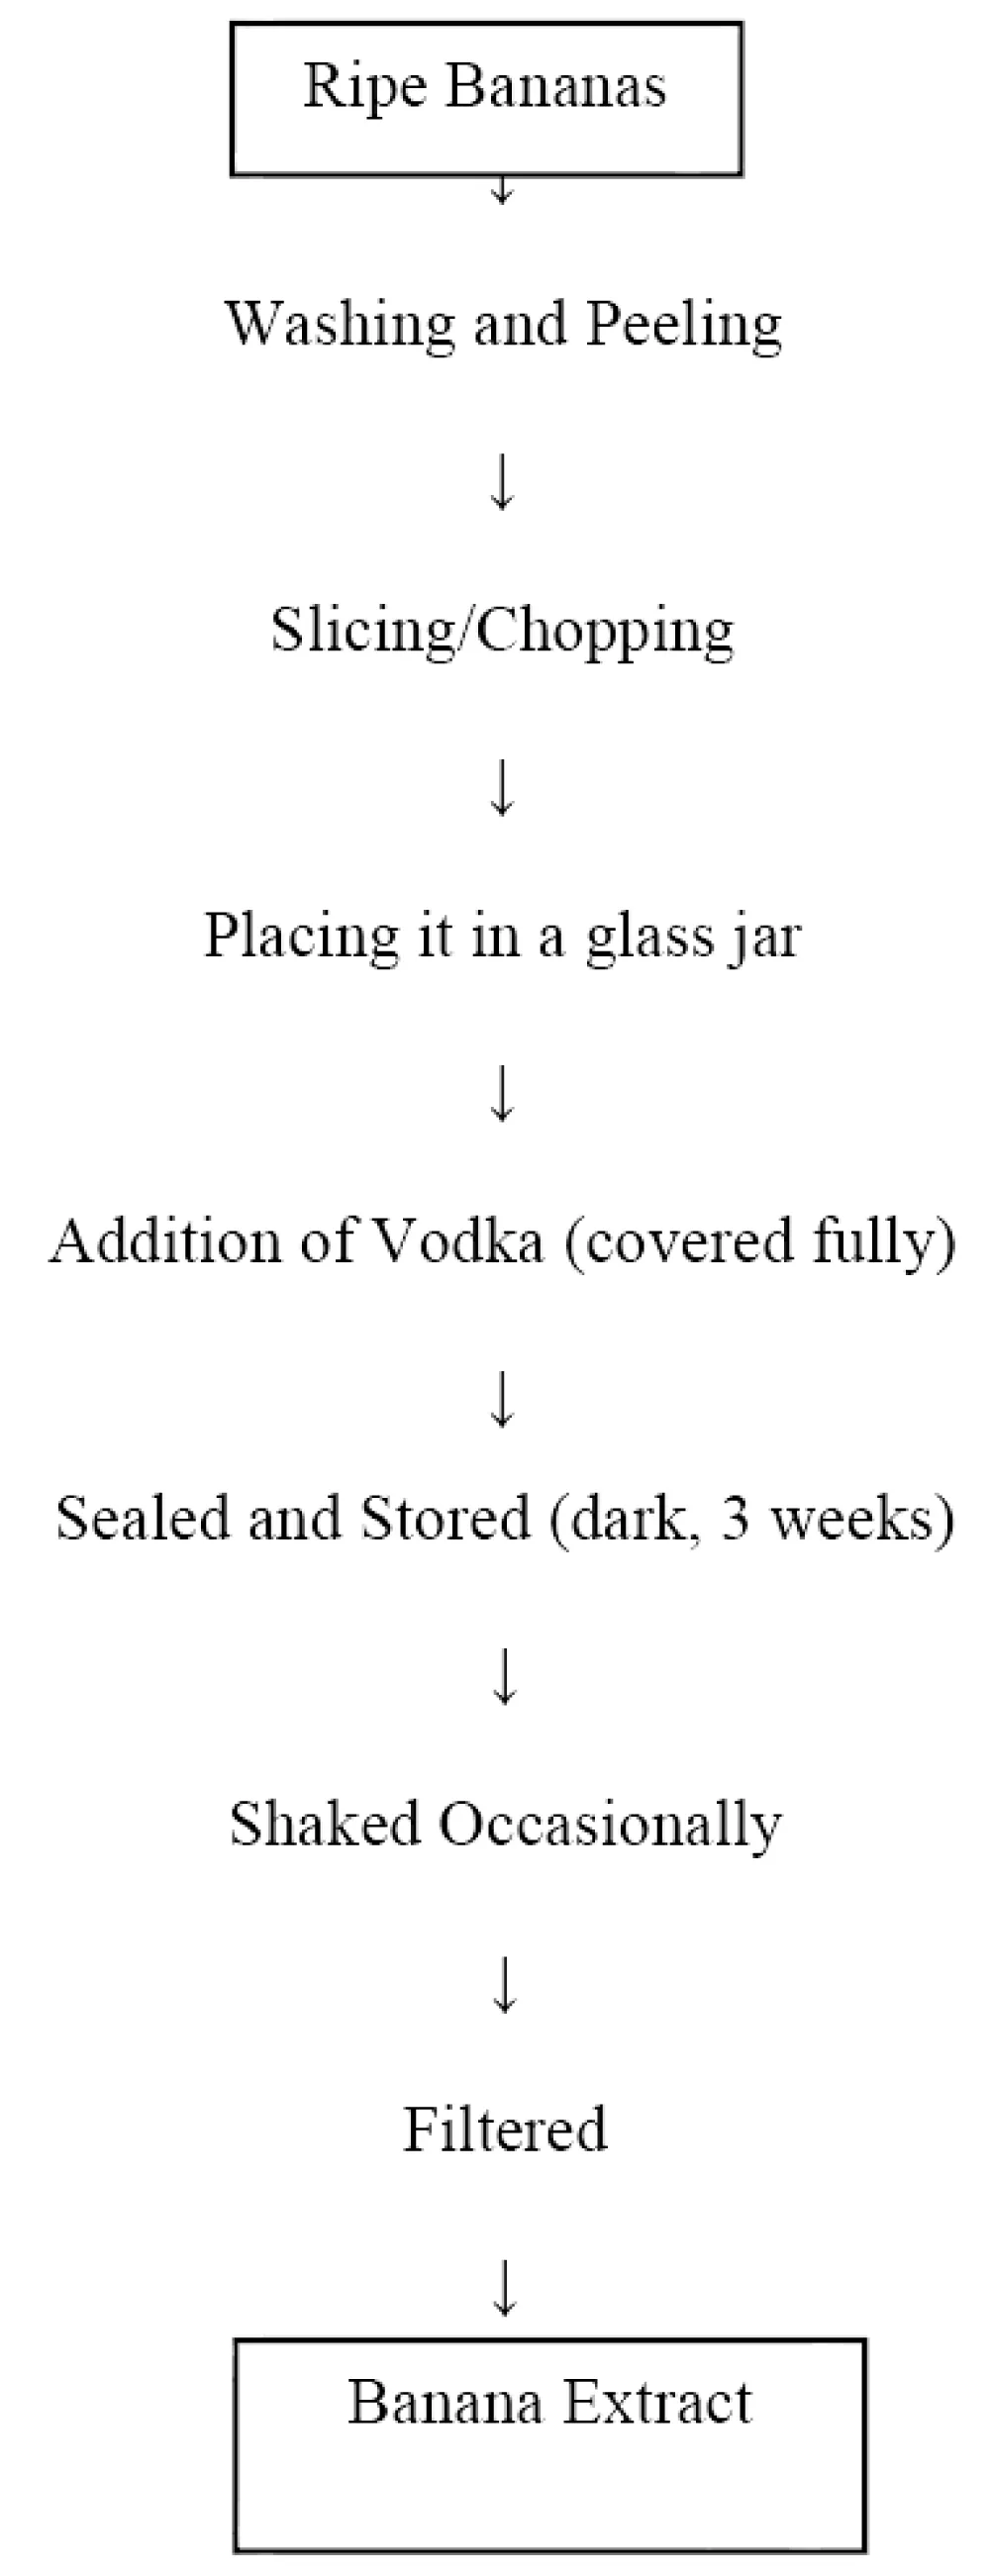
Banana extract was prepared according to the methods described by McGee and Miftari and Berisha with slight modifications. Fresh ripe bananas were thoroughly washed to remove adhering dirt and contaminants, and subsequently peeled manually. The peeled bananas were sliced into smaller pieces to increase the surface area for efficient extraction. The sliced banana pieces were placed into a clean glass jar, after which vodka was added until the samples were completely submerged to facilitate solvent extraction of flavor compounds and bioactive constituents. The glass jar was tightly sealed and stored in a dark environment for three weeks to allow proper extraction. During the extraction period, the mixture was shaken occasionally to improve solvent interaction and extraction efficiency. At the end of the storage period, the extract was filtered using muslin cloth or filter paper to separate the liquid extract from solid residues. The resulting banana extract was collected and stored appropriately until further use (Figure 4).
Preparation of oat wheat bread enriched with rice bran and banana extracts
The development of functional bread products has gained increasing attention in recent years due to the rising demand for healthier food alternatives. One such product is bread made from a composite of oat and wheat flour, enriched with rice bran and banana extract. This formulation aimed to enhance the nutritional profile of conventional bread by increasing dietary fiber, essential micronutrients, antioxidants, and bioactive compounds. In this process, oat flour was blended with wheat flour to partially replace the wheat component, typically at substitution levels ranging from 20–40%, as recommended by Gujral and Gaur. Rice bran is added for its high fiber content, gamma-oryzanol, tocopherols, and tocotrienols, which contribute to improved heart health and antioxidant activity [29]. Banana extract, derived from ripe banana pulp, adds natural sweetness, flavor, and minerals such as potassium and magnesium, while also contributing to guiumoisture and fermentable sugars that aid yeast activity.
The bread was produced using a modified straight-dough method as described by Sidhu et al., , and further elaborated by Gujral and Gaur, where the loaves were grouped into three samples and the control sample, with Sample ABX being 80% wheat and 20% Oat flour, Sample BBX being 70% wheat and 30% Oat flour, Sample CBX being 60% wheat and 40% Oat flour and Sample DBX (Control) 100% wheat flour with a constant 10g of Rice Bran flour throughout the samples and 4 teaspoons of Banana Extracts Enrichment. The production started with the Scaling of Ingredients (flour, water, yeast, sugar, salt, margarine milk, etc.), I then mixed all of the ingredients with margarine and eggs being the last to be added to form the dough, I started kneading until it became smooth and Elastic then allow for first fermentation which took about 20 minutes for all samples to allow the dough to double in size, shaped into loaves and panned the dough in well-greased pans and allowed for second Fermentation for Sample A it took about 40mins, for Sample B 50mins, for Sample CBX 1hour and Sample DBX was for 30mins after which the samples were baked in a preheated gas oven of 200oC for 25mins for Sample DBX, 28mins for Sample (ABX, BBX, CBX) until Sample DBX golden brown, Sample A light brown, Sample BBX dull brown, Sample CBX earthy brown and then all of the samples were allowed to cool for about an hour before packaging. Studies by Sidhu et al., and Gujral and Gaur, have shown that composite flours can be used effectively in bread production with acceptable baking and sensory qualities, provided the ratios are well-optimized [Table 1].
Quality Evaluation
Proximate Composition: Protein Determination
Protein is a crucial nutritional component in bread, influencing its texture, nutritional value, and consumer acceptability. In my study, determining the protein content of oat-wheat composite bread enriched with rice bran and banana extract helped to assess its nutritional improvement compared to conventional bread. It’s important because it evaluated the nutritional enhancement from rice bran (high in protein) and banana extract, ensured the product would meet the dietary protein requirements, and helped correlate protein content with bread texture and shelf life. The Kjeldahl method, as described by AOAC (1990), was used for the protein determination. The protein content is calculated like this:
Percentage of Nitrogen:
Where:
V = Volume of HCl used (mL)
N = Normality of HCl (0.1N)
W = Sample weight (g)
1.4007 = Conversion factor for nitrogen
Percentage of Crude Protein
%Protein = %N ×Conversion Factor
Wheat protein factor = 5.83
Oat protein factor = 6.25
Rice bran protein factor = 5.95
For composite bread, the average factor is (~6.0)
At the end of the experiment, it was observed that:
Rice bran significantly boosted the protein (12–15% vs. 8–12% in control). Banana extract may not have increased the protein, but contributed to the flavor, fiber, and higher protein improved the nutritional profile, but slightly affected the dough elasticity.
Fat determination
Fat content is an essential quality parameter in bread evaluation as it contributes to texture, flavor, mouthfeel, and caloric value. The determination of fat in the bread samples was done using Soxhlet extraction as described by AOAC (2005), a standard gravimetric method where fat was extracted from a dried sample using a non-polar solvent like petroleum ether or hexane. Where 1g weight of dried, ground bread sample was placed in a thimble and extracted with solvent in a Soxhlet apparatus for several hours. After extraction, the solvent evaporated, and the remaining fat was weighed.
Formula
Where:
W1= Weight of dried sample (g)
W2 = Weight of flask + extracted fat (g)
W3= Tare weight of empty flask (g)
Dietary fiber determination
Dietary fiber determination
Dietary fiber content is an important parameter in the nutritional evaluation of bread, especially when it is enriched with high-fiber ingredients such as oat flour, rice bran, or banana. Dietary fiber consists mainly of cellulose and lignin, which are resistant to digestive enzymes and contribute to digestive health. In my study, analyzing fiber content demonstrated how rice bran (insoluble fiber) and banana extract (soluble fiber) improved the nutritional profile of oat-wheat bread compared to conventional formulations. The standard method for determining crude fiber involves acid and alkali digestion to simulate the human digestive process. The sample was digested with 1.25% sulfuric acid, followed by 1.25% sodium hydroxide. The remaining residue was dried, weighed, then ashed in a muffle furnace at 550°C, and the ash weight was subtracted to get the crude fiber. Enzymatic-Gravimetric, as described by AOAC (1995), was used for the determination of total dietary fiber (TDF).
Formula
Where:
W1 = Crucible weight (g)
W2 = Crucible + dried residue (g)
W3 = Crucible + ash (g)
M1 = Sample weight (g)
Ash determination
Ash content is a measure of the total mineral content in bread and is an important indicator of its nutritional value and purity. In quality evaluation, it helped determine the presence of essential minerals and the extent of refining in the flour used. Ash determination was carried out by incinerating a known weight of the dried bread sample in a muffle furnace at 550°C until all organic matter was burned off, leaving only inorganic mineral residues (ash). The remaining ash was then weighed. In my study, analyzing ash content helped to evaluate the mineral contribution of rice bran (rich in phosphorus and magnesium) and banana extract (a source) in the enriched bread formulation. Dry Ashing, as described by AOAC (1990), was used for its determination.
Formula
Where:
W0 = Crucible weight (g)
W1 = Sample weight (g)
W2 = Crucible + ash weight (g)
Determination of carbohydrates content
Carbohydrates are the primary energy component in bread. Nutritional value (digestible vs. fiber content), Glycemic index (health impact), texture, and browning. This analysis was meant to quantify the total carbohydrates in my enriched bread and differentiate between Available carbohydrates (sugars, starch) and Dietary fiber (already analyzed separately).
The Carbohydrate content was determined by difference using the formula below:
% Carbohydrates = 100 – (% Ash + % Protein + % Fat + % Fiber) (5)
Physical analysis
Loaf Weight (g)
I measured the weight of each loaf after baking and cooling using a digital weighing balance and compared the weight of control bread (without enrichment) and enriched bread samples.
Control Sample (DBX) = Total Weight = 160g
Samples (ABX, BBX, CBX) = 210g
Loaf Volume (cm³)
I determined the loaf volume using the Seed displacement method, where I placed the loaf in a container filled with rice seeds.
Volume = Length x Width x Height (6)
Specific Volume (cm3/g)
The specific volume of the samples, which is a physical property of the samples that expresses the ratio of the loaf volume to the loaf weight, was determined by
Crust and crumb color analysis
I used sensory evaluation to assess crust and crumb color changes due to oat, rice bran, and banana extract enrichment, and to check whether the presence of rice bran and banana extract may have darkened the crumb or crust. Sample ABX’s Crumb and Crust was flaking, but not to the extent of Sample CBX’s Separation and the Crust was Light Brown, Sample BBX’s Crust and Crumb was firm no flaking or Crumbly and the Crust was Dull brown in color, Sample CBX’s Crust was severely Crumbling (Separation), crumb was as firm as Sample ABX and the Crust color was greyish brown (earthy brown) and the Control Sample (DBX) was Soft, Firm, milky and Golden brown in Color.
Oven spring analysis
This is the Rapid rise (Increase in loaf height) that happens in the first few minutes of baking due to yeast activity, gas expansion, and steam before the crust sets, and I was able to determine this using a Simple Ruler Method
Determination of selected minerals and vitamin
Using the AOAC (2016) official method, the mineral contents (Phosphorus, Magnesium, Calcium) in the samples were determined by measuring 1g of the sample, crushing the samples into powder, then mixing them with Nitric Acid (HNO3) to break them down into solution. The solution was put into a machine called Atomic Absorption Spectrophotometry (AAS) to detect and measure each mineral in the different samples. For Vitamin B3 (Niacin) determination, the bread samples were crushed into a powder form, and Vitamin B3 was extracted using a mix of water and Hydrochloric Acid (HCL). This helped to release the niacin from the food matrix and heated up the mixture to break any bonds holding the niacin, making it easier to detect. Once extracted, the liquid was cleaned and filtered. The sample was analyzed using High Performance Liquid Chromatography (HPLC), which separated niacin from other substances and showed how much was present.
Shelf-life study
The shelf life was determined using two parameters, Microbial Load and Sensory Qualities, for all samples for 10 days, while doing analysis every five days to track the progress. Based on the Sensory qualities for the first five days, Sample DBX started to develop an unpleasant taste and Reduced Aroma, no visible growth of Molds, crust, and crumb started flaking, and the color was still golden brown. Sample ABX also started developing an unpleasant taste, but still manageable, crust and crumb started crumbing, no visible growth of molds, and the color was still light brown. Sample BBX had no visible growth of molds; the taste was still good, just a bit off, the crust and crumb were firmer than all the samples, and the color was still dull brown. Sample CBX had both crust and crumb was separating more than sample ABX, visible growth of white molds on the surface, Aroma was greatly reduced, taste was still better than sample ABX, and color was still earthy brown.
For the remaining five days, Sample DBX had a visible growth of molds (white, green, and greenish yellow) on and in the loaves, crust, and crumb, which were flaking as it was five days ago, and it was also soft, had a very strong, unpleasant taste and aroma with the same golden-brown color it had five days ago. Sample ABX had a visible growth of molds (white and greenish yellow) on and in the loaves, the crust and crumb were soft, separating, and it started developing a strong, undesirable aroma and taste; it still had the same dull brown color. Sample BBX had a slightly visible white molds in and on the loaves, the crust and crumb were firmer than all the samples, and were less crumbly than all the samples, the unpleasant taste and aroma of the loaves was not that strong, and the color was still dull brown. Sample CBX had the most unpleasant aroma and taste, with visible growth of white molds more visible than in Sample BBX, on the loaves. The crust and crumb were soft and as firm as Sampe B, and the color was still earthy brown.
The shelf life of the samples based on the Microbial Load. The microbiological quality of the bread samples was evaluated at 5-day intervals (Day 0, 5, 10). For the microbiological analysis, 10 g of each sample was homogenized in 90 mL of sterile 0.1% peptone water to obtain a 10⁻¹ dilution. All tests were carried out in duplicate, and results were expressed as colony-forming units per gram (cfu/g).
Total Viable Count (TVC): Plate Count Agar (PCA) was disseminated with aliquots (0.1 mL) from suitable dilutions and incubated for 24 hours at 35 °C. Plates containing 30–300 colonies were tallied.
Total Coliform Count: Violet Red Bile Agar (VRBA) was used to disperse aliquots, which were then incubated for 24 hours at 35°C. We counted typical pink/red colonies with biliary precipitation.
E. Coli Count: Eosin Methylene Blue (EMB) agar was used to disseminate aliquots, which were then incubated for 24 hours at 35 °C. E. coli colonies were identified by their metallic green shine.
Fungal Count (Yeasts and Molds): Aliquots were placed on Potato Dextrose Agar (PDA) supplemented with 100 mg/L of chloramphenicol and cultured for five days at 25 °C. Molds (filamentous colonies) and yeast (creamy colonies) were counted.
Functional properties of the composite flour blends
The flour blend samples’ bulk density, water and oil absorption capacity, swelling capacity, gelatinization temperature, Solubility Index, and other characteristics were ascertained using the functional properties.
Bulk density
The technique outlined by Onabanjo and Ighere (2014) was used to calculate bulk density. After weighing 1g of each flour sample into a measuring cylinder (10 mL), I tapped the cylinder in my hand until the samples separated, and then I recorded the volume.
Water Absorption Capacity (WAC) and Oil Absorption Capacity (OAC)
These were determined by the methods described by Onabanjo and Ighere (2014). For WAC, the test tubes were weighed first and recorded, then1g of each of the flour blend samples was weighed and added into a test tube, 10 mL of water was then added into it, the samples were poked to help the samples absorb water using a broom stick, centrifuged for 10mins and decanted, after the decantation the test tubes were weighed again using the weighing balance and recorded. The same procedure was used for oil absorption capacity, except that water was replaced with vegetable oil. Water absorption and oil absorption capacity were expressed as shown below:
WAC/OAC (g/g) = Final weight of sample after absorption – Initial weight of sample before absorption (9)
Swelling Capacity (SC)
Following the Bulk density determination, after recording the volume from the measuring cylinder, 10ml of water was added to the 10 mL measuring cylinder and allowed to sit for a while, and the volume was recorded again after allowing it to swell.
Gelatinization temperature and boiling point
These were determined by the methods described by Onwuka (2005). For both gelatinization temperature and boiling point, 5g of the flour samples were weighed into different beakers, added 50 mL of water into the beakers containing the samples, boiled the sample on a hot plate until the boiling water became thickened like gel, took down the temperature of the solutions using a thermometer, then after taking down the gelatinization temperature when the solution starts boiling, took the temperature reading using a thermometer to a certain boiling point. The temperature of the gel formed, and the boiling point were recorded in oC.
Solubility index
The solubility was determined using the Water Solubility Index (WSI) method as described by Onwuka (2005). In this method, 1g of the flour sample was dispersed in 10 mL of distilled water, then heated at 82°C for 25 min with stirring. After cooling, the slurry was centrifuged (3,200 rpm, 10 min), and the supernatant was then collected. The supernatant was dried in an oven at 105 °C to constant weight.
Sensory evaluation
In the sensory evaluation, a paired-comparison test was used as described by Iwe (2002). The criteria for selection of the panelists were based on whether (a) they were available and willing to participate in the sensory evaluation tests, (b) they were regular consumers of wheat bread, (c) they were of sound health, no allergies or infections, and dentures, and (d) they were not color blind and could taste sweet, bitter, and umami tastes. 10 semi-trained panelists were made to assess the samples for taste, color, aroma, and overall acceptability. And each sample was rated according to a nine-point hedonic scale with 9 = Like extremely and 1 = Dislike extremely.
Statistical analysis
The analyses were performed in duplicates, and the data obtained from the study were analyzed using Analysis of Variance (ANOVA), and the means will be separated using Fisher’s Least Significant Difference (LSD). The data was analyzed using Microsoft Excel at (p≥0.05).
Results and discussions
Results
Discussion
F: Functional Properties of the flour samples
The functional properties of the different flour blends were stipulated in Table 2. The Physicochemical/functional properties are used to determine the behavior of food materials, Olawuni, et al., However, the functional parameters determined include the solubility, swelling index, Bulk density (BD), gelation capacity, Boiling point, water absorption capacity (WAC), and Oil absorption capacity (OAC). The solubility index of the flour samples ranged from 5.54% to 4.28%, with sample ABX having the highest mean score, while sample CBX had the lowest mean score. However, there were significant differences among all the samples (P<0.05). Also, sample DBX and BBX recorded 4.40% and 4.62% and were also significantly different from each other (P<0.05). The swelling index revealed that sample ABX has the highest mean score, followed by sample CBX, even though sample ABX was not significantly higher than sample CBX. This implied that there was no significant difference between the two samples (P>0.05), with each of them recording a mean score of 1.78 and 1.79 g/g, respectively. Nevertheless, the swelling index measures how much water the flour can absorb. Higher swelling capacity can contribute to better texture and structure. Sample ABX has the highest swelling capacity (2.05 g/g), which might be beneficial for baked goods or products requiring moisture retention.
The bulk density (g/cm³) measures the weight of the flour per unit volume. Lower bulk density can affect packaging and storage. Sample CBX has the lowest bulk density (0.50 g/cm³), which might impact packaging and storage costs. Also, sample ABX, BBX, and DBX recorded mean scores of 0.56 g/cm3, 0.55 g/cm3, and 0.55 g/cm3, respectively. Therefore, statistical analysis revealed that there were no significant differences among the three samples (ABX, BBX, and DBX) at 95% confidence level (P>0.05).
Similarly, gelation temperature (°C) is the temperature at which the flour forms a gel. Lower gelation temperatures can be beneficial for certain applications. Sample ABX has a significantly lower gelation temperature (50.00°C) than others, making it potentially suitable for applications requiring low-temperature processing. Nevertheless, sample BBX and DBX scored 60.05 oC and 68.00 oC respectively, and as a result, they were not significantly different from each other (P>0.05). Similarly, the boiling point (°C) is the temperature at which the flour mixture boils; thus, higher boiling points can indicate better thermal stability. Nevertheless, sample BBX has a significantly higher boiling point (92.00°C), suggesting it might be more suitable for high-temperature applications. This is followed by sample ABX and CBX, which recorded mean scores of 85.00 oC and 85.05 oC.
WAC (g/g) refers to water absorption capacity, which measures how much water the flour can absorb. Higher WAC can contribute to better texture and structure. Sample ABX and CBX have higher WAC values (1.12 g/g and 1.14 g/g, respectively), indicating they might be more suitable for applications requiring high water absorption. Nevertheless, samples ABX and CBX recorded 1.12 g/g and 1.14 g/g, respectively.
Oil Absorption Capacity measures how much oil the flour can absorb. Higher OAC can be beneficial for certain applications. Sample BBX has a significantly higher OAC value (111), which might make it suitable for applications requiring high oil absorption. Sample ABX and CBX were significantly different from each other, while sample BBX and CBX were not significantly different (P>0.05).
Therefore, the results suggest that each flour sample has unique functional properties, making them suitable for different applications. For example, sample ABX (80% Wheat + 20% Oat + 10g of Rice bran) seems suitable for applications requiring high solubility, swelling capacity, and low gelation temperature. Sample BBX (70% Wheat + 30% Oat + 10g Rice Bran) might be more suitable for high-temperature applications and products requiring high oil absorption. The significant differences (p≤0.05) in functional properties among the flour samples can be attributed to the varying compositions of wheat, oat, and rice bran. The results suggest that adjusting the proportions of these ingredients can impact the functional properties of the flour, making it more suitable for specific applications.
Physical properties of the bread samples
The mean scores of the physical properties of different bread samples are shown in Table 3. The physical properties determined include loaf volume (cm3), Loaf weight (g), and Oven Spring.
From the table, it could be observed that sample DBX (100% wheat flour) has the highest loaf volume (252.00 cm³), indicating better aeration and texture. While sample ABX (80% wheat + 20% oat + 10g of rice bran) and BBX (70% wheat + 30% oat + 10g rice bran) have relatively lower loaf volumes, but still comparable to each other. Also, sample CBX (60% wheat + 40% oat + 10% rice bran) has the lowest loaf volume, suggesting that high oat content might affect bread structure. Statistically, all the samples were significantly different from each other in relation to the loaf volume. Similarly, the result of the loaf weight showed that samples ABX, BBX, and CBX scored 210.00 grammes respectively, and by implication, there were no significant differences among them (P>0.05). However, the sample DBX recorded 160.00 and was the least measured. As a result, it differed significantly from other samples.
Among the enriched samples, ABX (80% wheat + 20% oat + 10g of rice bran) recorded the highest specific volume, followed by BBX (70% wheat + 30% oat + 10g of rice bran), while CBX (60% wheat + 40% oat + 10g of rice bran) had the lowest value. The progressive decline in specific volume with increasing oat flour substitution can be attributed to gluten dilution. Oat flour contains β-glucan and non-gluten proteins that interfere with gas retention and weaken the dough matrix. This reduced loaf expansion and produced a denser bread crumb. Similarly, the fiber content in rice bran increased the dough viscosity and interrupted the gluten film formation, further reducing loaf height and volume.
Sample DBX has the highest oven spring (78.00), indicating better yeast activity and dough structure, while sample ABX and BBX have lower oven spring values, with CBX showing no oven spring, suggesting that high oat content might affect yeast activity. Therefore, the statistical analysis showed that there were no significant differences among the samples.
Notwithstanding, the addition of oat and rice bran affects bread’s physical properties, with varying effects on loaf volume, weight, and oven spring. Sample DBX (100% wheat flour) performs well in terms of loaf volume and oven spring, but has a lower loaf weight. Also, ABX and BBX showed potential as alternatives to traditional wheat bread, with relatively good loaf volumes and weights.
The results showed that sample DBX might be suitable for applications requiring a light and airy texture, such as sandwich bread or toast, while sample ABX and BBX could be used for bread products requiring a slightly denser texture, such as whole grain bread or artisanal bread.
Sensory evaluation of the bread samples
The mean scores of the sensory evaluation of the different bread samples are presented in Table 4. Thus, a 9-point hedonic scale was used for the determination of the different sensory parameters, ranging from aroma, appearance, texture, taste, and general acceptability. For the aroma, samples BBX (70% wheat + 30% oat + 10g of rice bran) and DBX (100% wheat) have higher aroma scores, indicating a more appealing smell. This could be due to the Maillard reaction, a chemical reaction between amino acids and reducing sugars that occurs during baking, resulting in the formation of new flavor compounds. The aroma scores for ABX and CBX are lower, suggesting that the higher oat and rice bran content might affect the Maillard reaction or the volatility of aroma compounds. Similarly, samples ABX and DBX have higher appearance scores, indicating better visual appeal. This could be due to the better structure and volume of these bread samples, as observed in the physical properties evaluation. The appearance scores for sample BBX and CBX are lower, which might be related to the darker color and coarser texture of these bread samples.
Moreover, samples BBX and DBX have higher texture scores, indicating better mouthfeel. This could be due to the better structure and volume of these bread samples, which would result in a softer and more tender crumb. The texture scores for BBX and CBX are lower, suggesting that the higher oat and rice bran content might affect the texture of the bread, making it coarser or denser.
Consequently, sample BBX has the highest taste score, indicating a more appealing flavor profile. This could be due to the balance of sugars and acids in the bread, as well as the presence of oat-derived flavor compounds. Thus, sample DBX has a slightly lower taste score, which might be related to the absence of oat-derived flavor compounds.
On the general acceptability, samples BBX and DBX have higher general acceptability scores, indicating overall preference. This suggests that the sensory properties of these bread samples are more appealing to the panelists. The general acceptability scores for sample BBX and CBX are lower, indicating that these bread samples might require further optimization to improve their sensory properties. By implication, the results suggest that sample BBX (70% wheat + 30% oat + 10g of rice bran) is a promising formulation for developing a healthier bread option with acceptable sensory properties. Also, the addition of oat and rice bran affects the sensory properties of bread in relation to the textural properties.
The means scores of the proximate composition of the bread sample
The mean values of the proximate composition of the samples are shown in Table 5. The protein, fat, fibre, ash, and carbohydrate contents were determined. Thus, statistical analysis was used to determine the level of significant differences among the samples at P>0.05. Sample BBX had the lowest protein content, followed by sample ABX with a mean score of 10.20% and 11.10%, respectively. Sample ABX and BBX were not significantly different (P>0.05). Thus, sample DBX had the highest mean value of 12.26% for protein content, whereas sample CBX gave the lowest mean score of 10.20%. However, the two samples were statistically different from each other as well as all other samples (P>0.05).
Similarly, the fat contents of the bread samples, as shown in Table 6, revealed that sample DBX and BBX recorded mean values of 0.57% and 4.92%, respectively. Thus, this revealed that the two samples are not statistically related. Consequently, sample ABX differed significantly from all other samples (P<0.05) with a mean fat content of 3.46%. The fibre content of the sample, as shown in Table 6, also revealed that only sample BBX was significantly different from every other sample, while samples ABX, CBX, and DBX recorded mean values of 0.24%, 0.24%, and 0.22%, respectively. Statistical analysis revealed that sample DBX was not significantly lower than samples ABX and CBX.
Moreover, the ash contents of the samples showed that all the samples varied among each other. Thus, ash is described as the inorganic substances that are left over when the organic matter has been burnt away Odimegwu et al, 2020). The results obtained in this work are related to the values obtained in a work done by Olawuni et al (2023). Nevertheless, sample CBX had the highest ash content, followed by sample BBX, while sample DBX gave the least ash content. Therefore, the variations in the ash contents could be due to the differences in the level of substitutions of the flour samples used.
The carbohydrates were determined by difference, with sample ABX having the highest mean score (53.91%), followed by sample BBX with a mean value of 53.53%; as a result, they differed significantly from each other (P<0.05). On the contrary, samples CBX and DBX had mean carbohydrate contents of 53.49% and 53.47%, respectively. Statistical analysis showed that there were no significant differences between the two samples. Therefore, the differences in the carbohydrate contents could be a result of the variations in the nutritional constituents of the different flour blends used.
Minerals and niacin content of the bread samples
The mean values of the selected mineral contents of the samples are shown in Table 6. The minerals examined were phosphorus, calcium, and magnesium, while the vitamin B3 (Niacin) was evaluated owing to its abundance in the materials used for the production of the bread samples. The results showed that sample CBX had the highest phosphorous content of 298.50 (mg/kg), followed by sample BBX and DBX with mean scores of 292.15 mg/kg and 290.67 mg/kg of phosphorous, respectively. However, sample DBX was not significantly lower than sample BBX (P>0.05). Similarly, sample ABX had a mean value of 290 mg/kg of phosphorus and differed significantly from other samples (P<0.05).
The calcium contents of the samples, as shown in Table 6, indicated that sample ABX and CBX had the same mean score (0.47%), and as a result, were not significantly different from each other. Also, sample BBX had the lowest mean score of 0.34%, followed by sample DBX (0.45%), and were statistically different from each other (P<0.05). The percentage magnesium contents of the samples showed that all the samples were not significantly different from each other. Nevertheless, samples ABX, BBX, CBX, and DBX recorded mean values of 0.13%, 0.10%, 0.14%, and 0.14%, respectively. Despite the variations in the values, statistical analysis has shown that none of the samples is significantly higher or lower than the others (P>0.05).
The vitamin contents of the samples, as shown in Table 6, showed that the vitamin B3 decreases with an increase in the substitution of the flours. As a result, sample BBX had the lowest mean score, followed by sample ABX, whose values were 0.43 and 0.48 mg/100g, respectively. Nevertheless, samples CBX and DBX were not significantly different (P>0.05); hence, they had mean scores of 0.63 mg/100g and 0.61 mg/100g of niacin, respectively. Therefore, the variation in the vitamin contents could be a result of the levels of substitutions of wheat flour and rice bran flours with banana extracts.
Conclusion and recommendation
Conclusion
The study assessed how the functional, physical, sensory, nutritional, and microbiological properties of bread were affected when oat and rice bran were used in place of some of the wheat flour. The results showed that the addition of rice bran and oats had a major impact on the bread samples’ quality attributes. The functional property analysis’s findings demonstrated that every flour blend has distinct qualities appropriate for a range of culinary uses. Because of its exceptional solubility, swelling capacity, and low gelation temperature, sample ABX (80% wheat, 20% oat + 10g of rice bran) is suitable for bread goods that need to retain a lot of moisture. Conversely, BBX (70% wheat, 30% oat, and 10g of rice bran) demonstrated a greater boiling point and oil absorption capacity, suggesting that it is appropriate for high-fat or high-temperature food compositions.
In terms of physical attributes, DBX (100% wheat) had the highest oven spring and loaf volume, both of which are signs of proper bread structure and aeration. Despite having a larger oat and rice bran composition, ABX and BBX were still able to maintain acceptable loaf attributes that were on par with traditional wheat bread.
According to the sensory analysis, BBX and DBX were the most favoured in terms of flavour, texture, scent, and general acceptance. This suggests that adding oat flour in moderation (30%) can enhance nutritional value without sacrificing flavour.
All bread samples were microbiologically safe on day one, according to the shelf-life evaluation, but by day ten, fungal growth had steadily increased. The fact that E. coli was absent verified that all samples were made in a sanitary environment. The main element limiting storage stability was found to be fungal spoiling.
According to the proximate composition results, CBX (60% wheat, 40% oat, and 10g of rice bran) had the highest ash concentration, indicating a stronger mineral presence, whereas DBX had the highest protein content. All samples had comparatively constant carbohydrate levels.
In summary, using oat and rice bran instead of wheat flour improved the bread’s functional features and nutritional content while preserving tolerable sensory aspects. The BBX blend (70% wheat, 30% oat + 10g of rice bran) was shown to be the most effective formulation for creating bread that is both microbially and sensory-friendly and has improved nutritional value. This proves that using composite flour mixes can be a practical way to support healthy eating habits, encourage local agricultural use, and increase food security.
Recommendation
The following suggestions are offered in light of the study’s findings about the nutritional, sensory, functional, physical, and microbiological characteristics of bread manufactured with composite flours of wheat, oat, and rice bran:
- Ideal Blend for manufacturing: For commercial bread manufacturing, a formulation comprising 70% wheat flour, 30% oat flour, and 10g of rice bran (BBX) is advised. It offers improved nutritional value, sensory appeal, and baking performance in a desirable proportion. Without sacrificing consumer desire, this blend can be used as a healthier substitute for 100% wheat bread.
- Nutritional Improvement Strategies: To increase the bread’s protein, mineral, and fibre contents, food processors and bakers should investigate adding moderate amounts of oat and rice bran (10–30%). These composite formulations have the potential to improve cardiovascular health and dietary fibre intake.
- Enhancement of Shelf-Life: Natural or light chemical preservatives (such as vinegar, ascorbic acid, or plant-based antimicrobials) could be used to extend shelf life while preserving product safety and quality, as fungal spoiling was noticed after the fifth day of storage.
- Industrial Application: To lessen reliance on imported wheat flour, encourage agricultural value addition, and cut manufacturing costs in developing nations, the baking industry should be encouraged to employ locally supplied oat and rice bran.
Contribution to knowledge
- Creation of a Nutritionally Improved Composite Flour: The study was effective in creating and assessing composite flours made from rice bran, oats, and wheat that enhanced bread’s nutritional makeup without sacrificing its flavour. The most successful combination was found to be 70% wheat, 30% oat, and 10g of rice bran (ABX), proving that the best possible substitute can provide bread products with higher levels of protein, fibre, and minerals.
- Empirical Data on Functional Properties of Composite Flours: The study offered fresh empirical information on the functional characteristics of blends of wheat, oat, and rice bran, including solubility, swelling capacity, gelation temperature, and water/oil absorption. These results provide food technologists with useful reference information for refining recipes for baked goods and other flour-based items.
- Local Ingredients Provide Nutritional and Mineral Enrichment: The study found that adding oat and rice bran greatly raised the levels of important minerals like calcium and phosphorus as well as niacin (vitamin B3), improving the micronutrient profile of bread. This illustrates a useful strategy for correcting nutritional deficiencies using reasonably priced, regional foods.
- Encouragement of Local Agricultural Value Addition: The study encourages sustainable farming methods and supports the diversification of the food sector by making use of oat and rice bran, which are by-products and underutilized local resources. This is in line with national objectives to increase food self-sufficiency and lessen reliance on imported wheat.
Overall, by showing that carefully combining wheat, oat, and rice bran can enhance bread’s nutritional value and functional qualities, this study has added to the body of knowledge already available on the use of composite flour. In addition to supporting continued initiatives in sustainable food innovation, public nutrition enhancement, and industrial flour substitution research, it provides a scalable model for creating healthier, locally produced bakery goods.
Acknowledgment
The cooperation of all the staff of the Department of Food Sci and Tech, Federal University of Technology, Owerri, is hereby acknowledged.
- Cauvain SP. Breadmaking: improving quality. 2nd ed. Cambridge: Woodhead Publishing; 2012.
- Arranz-Otaegui A, Gonzalez Carretero L, Ramsey MN, Fuller DQ, Richter T. Archaeobotanical evidence reveals the origins of bread 14,400 years ago in northeastern Jordan. Proc Natl Acad Sci U S A. 2018;115(31):7925-7930. Available from: https://doi.org/10.1073/pnas.1801071115
- Samuel D. Brewing and baking in ancient Egypt. Egypt Archaeol. 2000;16:14-17. Available from: https://scispace.com/pdf/investigation-of-ancient-egyptian-baking-and-brewing-methods-4ysgbsfdsi.pdf
- Slavin J. Whole grains and human health. Nutr Res Rev. 2013;26(2):197-208. Available from: https://doi.org/10.1079/nrr200374
- Ludwig DS, Hu FB, Tappy L, Brand-Miller J. Dietary carbohydrates: role of quality and quantity in chronic disease. BMJ. 2018;361:k2340. Available from: https://doi.org/10.1136/bmj.k2340
- Kaplan R. The Jewish religion: a companion. Oxford: Oxford University Press; 2006. Available from: https://global.oup.com/academic/product/the-jewish-religion-9780198264637?cc=in&lang=en&
- Sutton MA, Bleeker A, Howard C M, Bekunda M, Grizzetti B, de Vries W, et al. Our nutrient world: the challenge to produce more food and energy with less pollution. Edinburgh: Centre for Ecology & Hydrology; 2013. Available from: https://nora.nerc.ac.uk/id/eprint/500700/1/N500700BK.pdf
- Gallagher E, Gormley TR, Arendt EK. Recent advances in the formulation of gluten-free cereal-based products. Trends Food Sci Technol. 2004;15(3-4):143-152. Available from: https://doi.org/10.1016/j.tifs.2003.09.012
- Rosell CM. The science of doughs and bread quality. Food Sci Technol Int. 2011;17(3):219-229. Available from: https://doi.org/10.1016/B978-0-12-380886-8.10001-7
- Rosell CM. Composite flours in breadmaking: applications and challenges. Food Chem. 2016;206:239-248.
- Rosell CM, Bajerska J, Wojtasik A. Bread and its fortification. J Cereal Sci. 2015;67:77-86. Available from: https://doi.org/10.1201/b18918
- Slavin J. Health benefits of whole grains. J Nutr. 2013;143(3):1-6. Available from: https://doi.org/10.1079/nrr200374
- Tufail T.Global wheat production and challenges. Agriculture. 2021;11(10):1-12. Available from:
- Bader UlAin H, Saeed F, Ahmad A, Ahmed M, Imran M. Nutritional and functional evaluation of composite flour bread prepared from wheat and cereal blends. Food Sci Nutr. 2019;7(8):2665-2673. Available from: https://www.itjfs.com/index.php/ijfs/article/download/2974/1809/26515
- Saeed . Nutritional composition of cereal grains. Food Sci Nutr. 2021;9(5):2560-2570.
- Tufail T. Structure and composition of cereal grains. J Food Compos Anal. 2018;67:65-75.
- Calder PC. Feeding the immune system. Proc Nutr Soc. 2013;72(3):299-309. Available from: https://doi.org/10.1017/s0029665113001286
- Hussain S, Anjum FM, Butt MS, Khan MI, Asghar A. Physical and functional properties of maize. J Food Process Preserv. 2021;45(4):1-10.
- Hussain S, Marko Jukić. Barley as a functional grain. J Cereal Sci. 2022;103:103-110. Available from: https://doi.org/10.3390/plants11243519
- Vinkx CJA, Delcour JA. Rye starch properties. J Cereal Sci. 1996;24(1):1-14.
- Saleh ASM, Zhang Q, Chen J, Shen Q. Millet grains: nutritional quality and health benefits. Food Sci Nutr. 2013;1(3):123-132. Available from: https://doi.org/10.1111/1541-4337.12012
- Awika JM, Rooney LW. Sorghum phytochemicals and their potential impact on human health. Phytochemistry. 2004;65(9):1199-1221. Available from: https://doi.org/10.1016/j.phytochem.2004.04.001
- Whitehead A, Beck EJ, Tosh S, Wolever TMS. Cholesterol-lowering effects of oat β-glucan. Am J Clin Nutr. 2014;100(6):1413-1421. Available from: https://doi.org/10.3945/ajcn.114.086108
- Kurek MA, Wyrwisz J, Wierzbicka A. Effect of oat β-glucan on bread quality. J Food Qual. 2017;2017:1-8.
- Houston DF. Rice bran and rice bran oil. Minnesota: AACC International Press; 2015.
- Gopalasatheeskumar K, Mohankumar R, Muthusamy S. Nutritional and functional properties of rice bran. Int J Food Sci Nutr. 2020;5(2):45-52.
- Wall MM, Tim J, Fernandez ML. Banana nutrition and health benefits. Food Chem. 2017;221:108-116.
- Hapsari L, Lestari DA. Fruit characteristics and nutrient values of banana (Musa spp.). Biodiversitas. 2016;17(2):617-622. Available from: https://doi.org/10.17503/agrivita.v38i3.696
- Saunders RM. The properties of rice bran as a foodstuff. Cereal Foods World. 1990;35(7):632-636. Available from: https://www.cabidigitallibrary.org/doi/full/10.5555/19911430310


 Save to Mendeley
Article Alerts
Subscribe to our articles alerts and stay tuned.
 This work is licensed under a Creative Commons Attribution 4.0 International License.