Annals of Environmental Science and Toxicology
Climatology and vulnerability to climate change in the “Altos de Jalisco” region, Mexico
Ramírez-Sánchez HU1*, Fajardo-Montiel AL2 and García Guadalupe ME1
2University Center of Tonala, Mexico
Cite this as
Ramírez-Sánchez HU, Fajardo-Montiel AL, García Guadalupe ME (2021) Climatology and vulnerability to climate change in the “Altos de Jalisco” region, Mexico. Ann Environ Sci Toxicol 5(1): 001-011. DOI: 10.17352/aest.000029The State of Jalisco has high levels of vulnerability to climate change, so it is necessary to identify the areas that present the highest risk. At present, it is important to have information to design and implement measures that reduce the effects of climate change on water resources. In Jalisco, the “Altos de Jalisco” and North regions are very vulnerable as they show a current and future water deficit. The objective of this study is to expose the conditions of vulnerability of water resources in the “Altos de Jalisco”, an area of great economic importance for Jalisco and Mexico. The intention is to show the climatic conditions, the changes experienced by climate change through R-Climdex indicators and projections of future scenarios of temperature, humidity and precipitation using PRECIS, to finally expose the vulnerability of the water resource in the region. The results show conditions that coincide with the IPCC reports regarding global estimates of water availability; by the middle of this century, a 10-30% decrease in fresh water is estimated in the dry tropical areas (Mexico and Jalisco) that are already suffering from water stress. It is likely that as the century progresses, an increase in temperature and decrease in relative humidity and intensity of rainfall, and the consequent increase in the extent of areas affected by drought. Likewise, a decrease in water reserves is expected, which would reduce the availability of water in the region as we approach the end of the century.
Introduction
It is well known that from the end of the 19th century (industrial revolution) the temperature of the earth has increased, a phenomenon associated with the increase in greenhouse gases (carbon dioxide, methane, nitrous oxide, ozone, chlorofluorocarbons, among others). The fifth assessment report of the Intergovernmental Panel on Climate Change estimated a warming of 0.85 ± 0.20 °C, during the period 1880-2012, for which have occurred independently several sets of data [1]. In the case of Mexico, the average maximum and minimum temperatures have increased by about 0.3 °C per decade during the period 1971-2000, for the country as a whole [2].
Regional studies on changes in temperature for China, Japan, Korean Peninsula, the Mediterranean region and Europe show consistent patterns with a general warming. The last decade of the last century and the first of this century have been the warmest years ever recorded. The phenomenon has been global in nature, although warming trends do not show a great spatial and temporal variability [3].
Most of the climate change projection studies have been carried out using average temperature records, without taking into account extreme temperatures. Since temperature is not only a component of climate change but also of climate variability, it is important to consider extreme temperatures both in the short- and long-term projections and at global and regional scales. The impacts on human comfort are related to extreme temperatures, especially those that exceed the daily tolerance levels for each of the different regions of the planet; another important factor is the frequency of these extreme events and their impact on water resources [4-7].
In addition to the impacts on comfort and human health, the impact on water resources is of paramount importance since they have implications on socioeconomic conditions, in the development of certain activities such as agriculture, livestock, forestry, energy generation, the development of industrial centers among others. Therefore, today it is of great relevance to carry out regional studies of climate change to evaluate the impacts in each particular region and not only to use global scale models [8-17].
Thanks to the development of supercomputing and progress in the understanding of the physical and chemical processes of the climate system and the development of regional modeling, more reliable regional projections of climate change can now be developed. However, there are social factors in each region (for example, the variation in population, economic development and the use of technology in each region, knowledge of the environment, the quantity and quality of meteorological and climatic data, among others, both current and future), which in many cases limit the efficiency of these regional models and cause greater uncertainty in climate projection modeling [18-21]. Hence, global climate scenarios have been developed and their possible consequences such as scenarios B1: 600 ppm, A1T: 700 ppm, B2: 800 ppm, A1B: 850 ppm, A2: 1250 ppm, A1FI: 1550 ppm [22] of greenhouse gases and RCP2.6, RCP4.5, RCP 6.0 and RCP 8.5 [23]; that have to do with radiative forcing. With these scenarios and with the help of Regional Models such as PRECIS (Providing Regional Climates for Impact Studies), it is possible to make regional approximations of future conditions with adequate data. In the same way, changes that have already occurred can be evaluated using past data to assess regional changes and their current and future implications through tools such as RClimdex that obtains indicators of climate change that have already occurred in the recent past.
The changes in temperature, relative humidity and rainfall in the state of Jalisco indicated by the general atmosphere-ocean circulation models show an impact of climate change as a result of the increase in greenhouse gases [2].
There have been efforts on a global/regional scale to determine the nature of extreme changes in other regions of the world, however, there is no certainty of such changes with regional details in this region of Mexico [18-21].
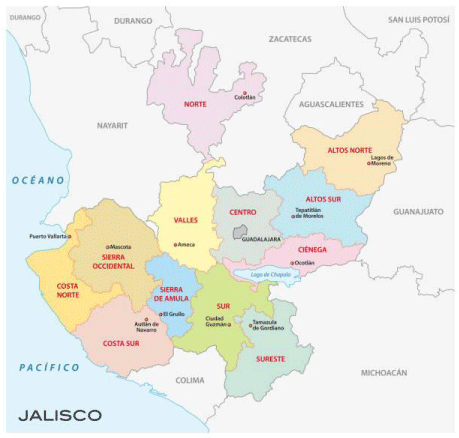
This study seeks to demonstrate the changes that have already occurred and future projections of temperature, humidity, precipitation, among other meteorological variables under climate change scenarios towards the end of the 21st century, and assess the vulnerability of the water resource through regional climate models for the “Altos de Jalisco” region (Figure 1).
Material and methods
In Mexico, the institution in charge of measuring and collecting meteorological data is the National Meteorological Service (SMN acronym in Spanish), which is a dependency of the National Water Commission (CNA acronym in Spanish), which in turn belongs to the Secretary of the Environment and Natural Resources (SEMARNAT acronym in Spanish). In the particular case of the state of Jalisco, there is a network of 208 stations distributed in 125 municipalities. Of these, only 48 belong to the Altos region (20 municipalities), from these stations the meteorological data were obtained during the periods 1971-2000 and 1981-2010 [24]. Before being used, said data was subjected to a validation of the same through tools provided by the RClimdex Software as a prerequisite to the calculation of the climate change indices, since any outlier or erroneous value could significantly alter the trends of each of the indexes evaluated. Thanks to this validation, outlier extreme values, lack of homogeneity and missing values were identified in the data series [25].
The mission of the Commission of Experts in Climatology (ET-CCDMI) of the World Meteorological Organization (WMO) is to assess the evolution of climate change indices. Thus, the WMO developed indexes of climatic change important for a global analysis through the regional evaluation of the changes in certain meteorological parameters [26]. Said indices were evaluated using the RClimdex software in each station to evaluate trends and these were compared with PRECIS simulations during the same period [25]. The meteorological data from the baseline (1971-2000) were used to evaluate the ability of the model to represent regional climatic characteristics by comparing the models with the in situ data in each of the stations in the state of Jalisco. This comparison made it possible to evaluate and eliminate possible biases due to differences in special density between the observation and the model representations. The PRECIS climatological data is extracted for the coordinates of the respective station where actual observation data is available. Thus, through this methodology, the trends were calculated for each station in time series for indices as important as temperatures, relative humidity and precipitation, among other climatological variables.
For the generation of PRECIS simulations of scenarios of the recent past period (1971-2000) and future scenarios of the period 2000-2100, the SRES (Special Reports on Emission Scenarios) A2 and A1B scenarios were used, both characterized by the focused regional development but with priority to economic issues in the first and environmental issues in the second. The regional PRECIS model was configured for the geographic domain comprised between -101 ° 28 ° W to -105 ° 42 ° W of west longitude and 18 ° 55 ‘° N to 22 ° 45’ ° N of north latitude with a horizontal resolution of 0.22 ° x 0.22 °.
Results
Climatology
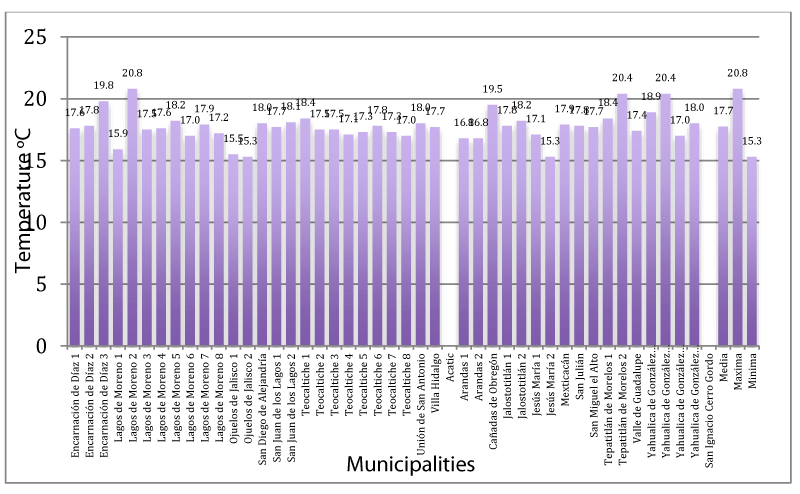
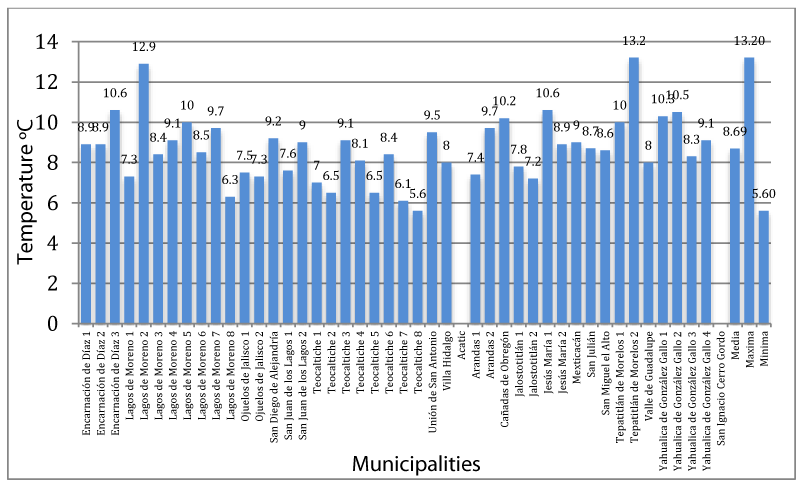
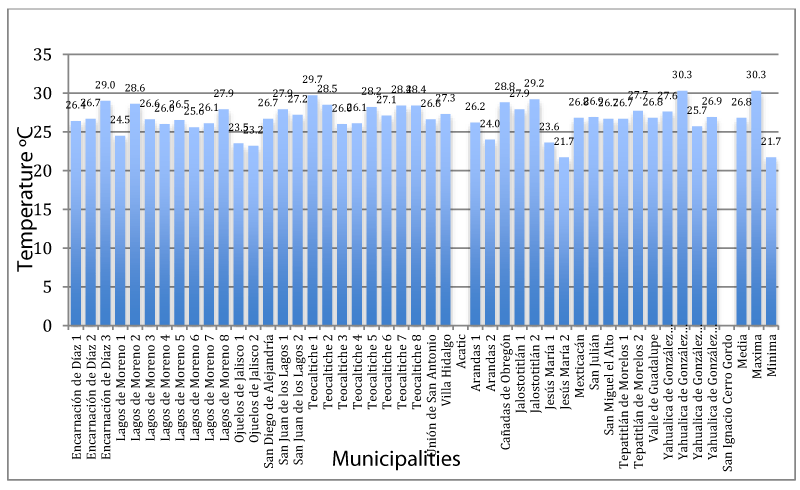
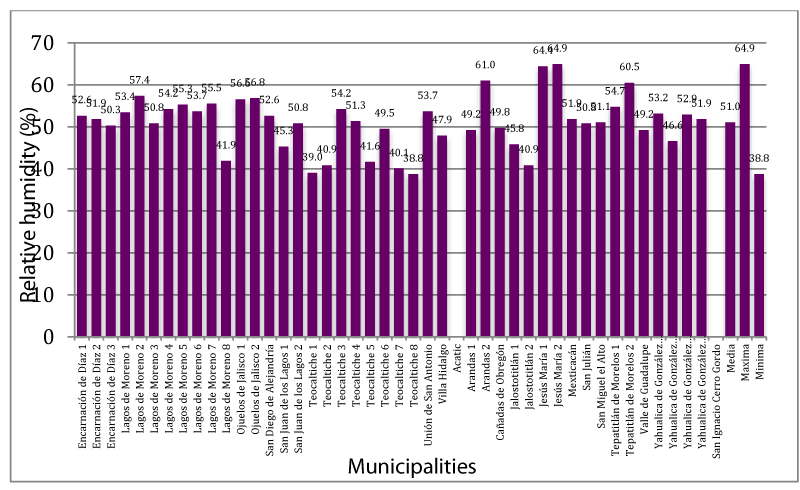
The region “Altos de Jalisco” is characterized by its semi-dry and semi-warm dry and temperate climate. The average temperature is 18 °C, with extremes of 15 -21 °C (Figure 2). The average minimum is 8 °C, ranging between 6-13 °C (Figure 3); and the maximum average is 27 °C, which oscillates between 23-30 °C (Figure 4). The average relative humidity is 50-53% with extremes of 39-65% (Figure 5). The predominant winds are northwest and southeast in direction with variable speeds up to 60 km/h.
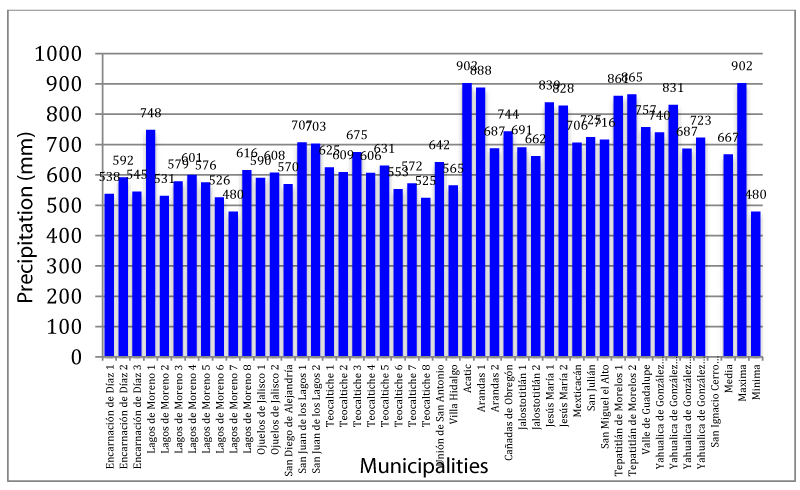
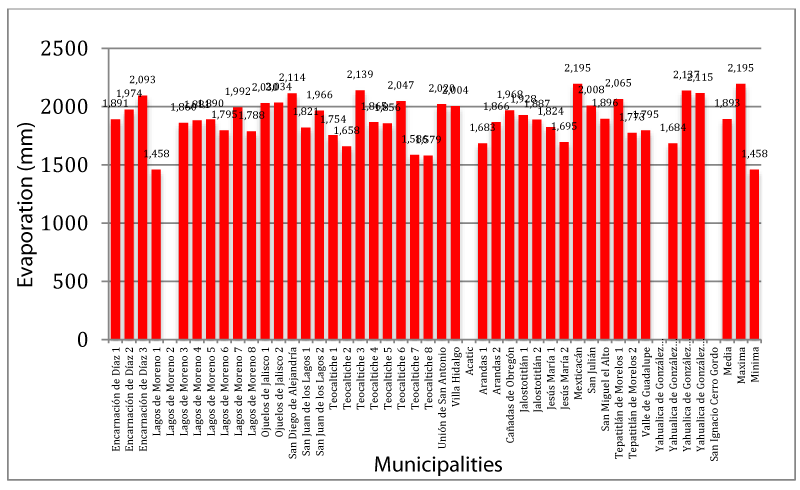
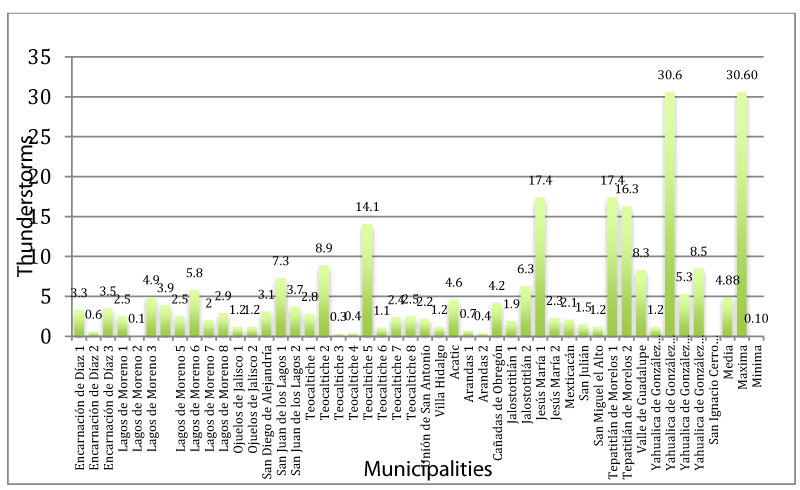
The mean precipitation is 683 mm, with ranges from 480 to 902 mm (Figure 6). The average evaporation of the region is 1907 mm with extremes of 1458 to 2195 mm (Figure 7). The average number of days with rainfall is 68 with values between 49 and 91 days. The average number of days with fog is 10, ranging from 0 to 73 days. The average number of days with hail is 1, located between 0 and 3 days. On the other hand, the number of days with thunderstorms was 5, with oscillations between 0 and 31 (Figure 8). The total number of days with frost is 24 with variations from 5 to 50. The average daytime temperature oscillation is 9 ° C, with a range between 6-11 ° C (Figures 2-8).
An analysis of the climates was carried out in the North and South high altitude regions, obtaining the following results:
• Región “Altos Norte” (Municipalities of: Encarnación de Díaz, Lagos de Moreno, Ojuelos de Jalisco, San Diego de Alejandría, San Juan de los Lagos, Teocaltiche, Unión de San Antonio and Villa Hidalgo)
This region is characterized by its semi-dry and semi-warm, with some dryness in Encarnación de Diaz and Ojuelos and temperate in Ojuelos and Teocaltiche.
The region is located at an average latitude of 21.45 °N, which oscillates between 20.99 and 21.88 °N; and an average longitude of 102.21 ºW located between 101.57 and 103.65 ºW. The average altitude is 1915 m, from 1480 to 2254 m.
The mean average temperature is 18 °C, with extremes of 15 and 21 °C. The average minimum temperature is 8 °C, ranging between 6 and 13 °C; and the average maximum temperature is 27 °C, which oscillates between 23 and 30 °C. The average relative humidity is 50% with extremes of 39 to 57%. The predominant winds are northwest and southeast direction with variable speeds up to 60 km/h.
The average precipitation is 597 mm, which ranges from 480 to 748 mm. The average evaporation of the region is 1884 mm with extremes of 1458 to 2139 mm. The average number of days with rainfall is 63 with values between 49 and 79 days. The average number of days with fog is 10, ranging from 0 to 73 days. The average number of days with hail is 0, located between 0 and 1 days. On the other hand the number of days with thunderstorms was 3, with oscillations between 0 and 14 days. The total of days with frost is 26.7 with variations of 13 to 50 days. The average daytime temperature oscillation is 9 °C, with a range between 8 and 11 °C.
• Región Altos Sur (Municipalities of: Acatic, Arandas, Cañadas de Obregón, Jalostotitlán, Jesús María, Mexticacán, San Julián, San Miguel el Alto, Tepatitlán de Morelos, Valle de Guadalupe, Yahualica de González Gallo and San Ignacio Cerro Gordo.
This region is characterized by its semi-dry and semi-warm climate, with a more temperate climate in Jesus Maria, Mexticacán and Valle de Guadalupe. The region is located at an average latitude of 20.96 °N, which oscillates between 20.61 and 21.28 °N; and an average longitude of 102.59 ºW located between 102.10 and 102.90 ºW. The average altitude is 1835 m, from 1400 to 2170 m.
The mean average temperature is 18 °C, with extremes of 15 and 20 °C. The average minimum temperature is 9 °C, ranging between 7 and 13 °C; and the average maximum temperature is 27 ºC, which oscillates between 22 and 30 ºC. The average relative humidity is 53% with extremes of 41 to 65%. The prevailing winds are southeast in direction with variable speeds.
The average precipitation is 770 mm, ranging from 662 to 902 mm. The average evaporation of the region is 1907 mm with extremes of 1683 to 2195 mm. The number of average days with rainfall is 73 with values between 56 and 91 days. The average number of days with fog is 11, ranging from 1 to 71 days. The average number of days with hail is 1, located between 0 and 3. On the other hand, the number of days with thunderstorms was 7, with oscillations between 0 and 31 days. The total of days with frost is 19.6 with variations from 5.3 to 32.7 days. The average daytime temperature oscillation is 9 °C, with a range between 6 and 11 °C.
Climate indicators RClimdex
For the calculation of the indicators of climate change, a database was constructed according to the climatological norm obtained from the site of the National Meteorological Service (NMS) of the National Water Commission (CONAGUA) to use the records of daily maximum and minimum temperatures as well as the amount during daily precipitation of the period 1982 to 2003.
A text file was constructed with the data ordered in columns by: year, month, day, precipitation (mm), maximum temperature (Celsius) and minimum temperature. Prior to the execution of RClimdex, a quality control (QC) of the data was performed. Finally with this data the RClimDex was executed.
The municipality of Lagos de Moreno presented the following indices of climate change: decrease in average days with frost from 1 to 6 days, variation from -50 to 140 in the average of summer days, variation from -0.8 to 0.3 days in the average of tropical nights, decrease between 0.2 and 3 days in the duration of the growing season, the maximum monthly value of maximum daily temperature increased by 3 °C, while the maximum monthly value of daily minimum temperature ranged from -2 to 0.5 °C, the minimum monthly value of daily maximum temperature decreased from 0.5 to 4 °C and the minimum monthly value of daily minimum temperature ranged from -1.5 to 2.2 °C. The average monthly difference ranged from -1.5 to 1.2 °C, the monthly maximum precipitation in 1 day increased from 2 to 10 mm, the monthly maximum precipitation in 5 consecutive days increased from 5 to 24 mm, the total annual precipitation divided by the number of wet days in a year increased to 2.7 mm / day, the number of days in a year where PRCP≥10mm ranged from -4 to 26mm, the number of days in a year where PRCP≥20mm ranged from -2.5 to 1 days, the maximum number of consecutive days with RR <1mm increase between 15 and 52 days, the maximum number of consecutive days with RR≥1mm ranged from -2 to 0.5 days, the total annual rainfall at which RR> 95th percentile oscillated between -100 and 45 mm, total annual rainfall in which RR> 99th percentile increased between 30 and 75 days and total annual rainfall on wet days (RR> = 1mm) increase between -50 and 50 mm.
Projections of climate change scenarios
To obtain the projections of scenarios of climate change to 2080, the model PRECIS (Providing REgional Climates for Impact Studies), developed by the Hadley Center in the United Kingdom, was used in a domain that covers the whole western part of the Mexican Republic with a resolution of 25 km (the largest provided by the program) and runs from 2000 to 2090.
The regional model used in both experiments was HadRM3P, which is based on the HadCM3 General Circulation Model, while baseline and boundary data (which includes predicted gas concentrations for each scenario) were provided by the Echam4 MCG in the case of the SRES A2 of 1250 ppm per year by 2010 and assuming fragmented technological changes and slower; And MCG HadCM3Q0 in the case of 850 ppm SRES A1B, which assumes balanced use of fossil and alternative sources.
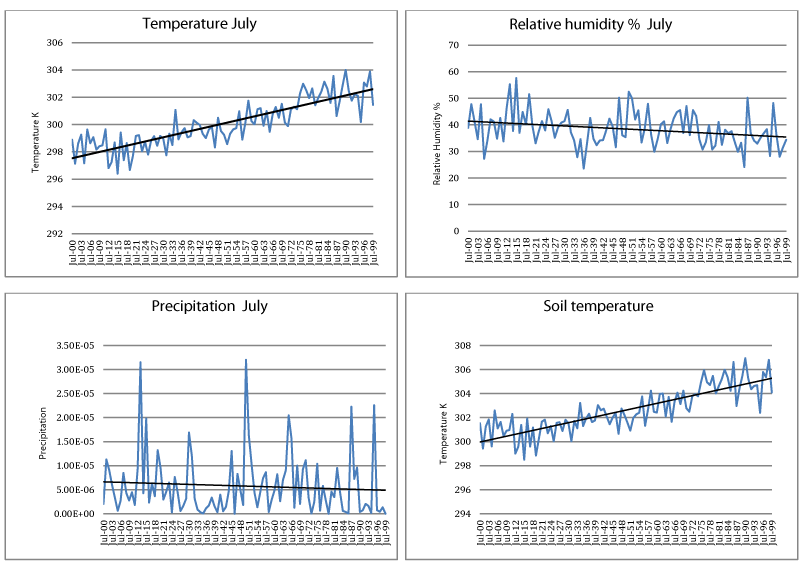
1. Analyzing Figure 9 concludes the following:The trend of air temperature in Altos de Jalisco is growing with an increase by the end of study period of nearly 5 °C.
2. The relative humidity is showing a reduction of about 5% by the end of study period.
3. The Intensity of Precipitation graph exhibits a downward trend. The soil temperature demonstrates an increase similar to that of the air temperature graph with an increase at the end of the study period of more than 5 ºC.
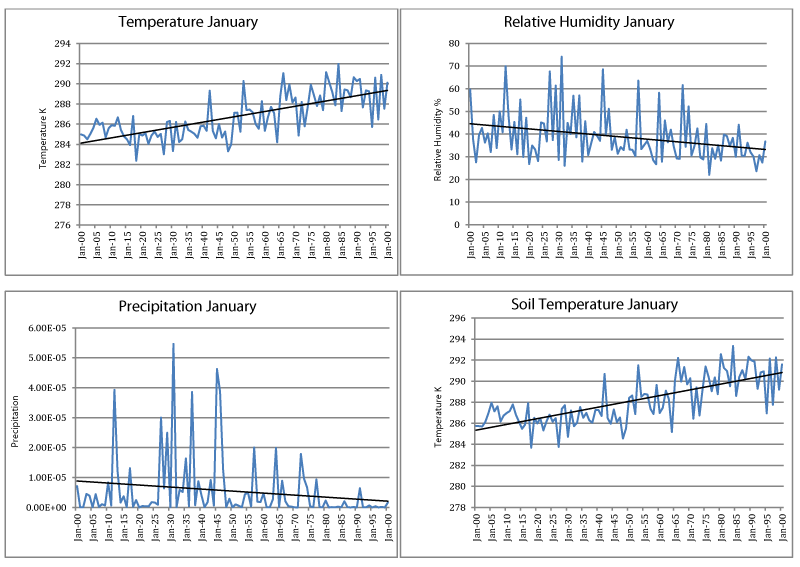
Analyzing Figure 10, we conclude the following
1. The trend of air temperature in Altos de Jalisco is also growing with an increase by the end of study period by about 5.5 ° C, higher than that found for period of the rainy season.
2. The relative humidity shows a strong tendency to decrease, decreasing by about 11% by the end of study period; this is also much higher than what was projected for the rainy months.
3. The Intensity of Precipitation graph demonstrates an alarming trend showing very low rainfall intensity by the end of the study.
4. The soil temperature tends to increase and the trend is similar to that of the air temperature with an increase at the end of the study period of analysis to a little more than 5 °C.
Discussion
The results suggest that the Altos de Jalisco region is exposed to strong increases in temperature, decreased rainfall and relative humidity and therefore a high risk of drought due to climate change. The combination of climate change and strong population growth is very likely to further exacerbate water scarcity. This situation begins to represent social unrest due to the fact that the basic needs of food, water for the population and development of all productive activities are no longer met. Therefore, climate change can become an indirect factor of social instability in the region.
For the Altos de Jalisco region, the projections of scenario A1B show a temperature increase of 3.5 °C for the period 2000-2100, with a decrease in humidity of 6%, a decrease in the intensity of precipitation and an increase of 3.6 ° C in soil temperature. Scenario A2 shows a temperature increase of 5.5 °C, relative humidity decreases up to 11%, there are significant decreases in the intensity of precipitation and increases in soil temperature up to 5 °C.
The climatic variables temperature and precipitation are the ones that are having the most impact on the availability of water, the increase in droughts, the impacts on agriculture and livestock, which are the main economic activities in the region. As in other parts of the world, a significant warming trend has been evidenced in recent decades, more pronounced in the summer and mainly with respect to minimum temperatures [27]. This is accompanied by increases in hot nights, hot days, and heat waves; reduction of cold waves among others [28]. Average precipitation during the rainy season has decreased in recent decades; as well as the rainfall during the wet season and that translates into a severe winter drought. The presence of some wet years is attributed more to climatic variability [27,29]. With regard to heavy rain events, most do not show significant trends, while a general increase in the frequency of droughts is more common.
The projections under an increase in greenhouse gases show considerable changes in the mean, variability and extremes of temperature and precipitation throughout the 21st century, which makes the region one of the main regions with the most important impacts by climate change. With respect to temperature changes, both the general circulation models (GCM) [30], and the scenarios developed here from regional climate models (RCM) project an annual and seasonal warming signal, as also evidenced by statistical projections. This coincides with studies such as those of the Coupled Models Intercomparison Project (CMIP5) that at the global level show an increase in the average temperature of approximately 4 °C in the summer and approximately 2.5 °C in the winter at the end of the 21st century under the moderate representative concentration (RCP 4.5) and 7 °C in summer and 4 °C in winter under the most pessimistic scenario RCP8.5 [31]. Likewise, strong increases in heat waves are projected; evidenced by the increase in warm nights, warm days and duration of warm periods. Regarding precipitation, the CMIP5 GCM set projects globally a decrease in precipitation of between 10% to 20% for many regions of the world [1], which is in the range evidenced in the present study for the region de los Altos. Overall, projected changes in extreme rainfall are uncertain, with little agreement between climate models. The results of the models consistently predict an increase in droughts, so that climate change is outlined in an increase in aridity and a reduction in the number of wet days [32].
Regarding the vulnerability of the water resource and its economic implications, in any scenario the population of this region is expected to be exposed to the following risks: High water deficit with increased evapotranspiration and decreased rainfall, water stress and increased demand for water, decrease and disappearance of livestock areas due to thermal stress, lack of availability of water and feed for livestock, substitution of livestock species by more resistant ones, very important losses in the production of dairy products and meat for human consumption in this zone that is a leader at the national level, loss of forest species, reduction in pastures in the high regions of the state, with the consequent extinction or migration of endemic species of the region, decreased productivity of crops in the region such as maize where the area is a leader, decreased availability of water for human consumption and agriculture, decreased production of agriculture and forestry, increased fires and droughts, decrease in cultivable areas, reduced length of seasons of vegetative growth and productive potential, risk in food security and exacerbation of malnutrition, salinization and desertification of agricultural land, risk of significant loss of terrestrial biodiversity, through extinction of endemic species and proliferation of invasive species, replacement of semi-arid vegetation with arid vegetation, an increase in endemic morbidity and mortality from diarrheal diseases, dengue, influenza, cholera, among others, resurgence of respiratory, cardiovascular, epidermal diseases, vector-borne diseases, contaminated water, increase in the budget allocated to health that in a certain time would be practically unfeasible. Climate change is expected to increase demand for heating and air conditioning in winter and summer respectively, increasing energy demand for large cities with higher consumption of fossil fuels if no commitment is made to the generation of renewable energies. The concentration of the population in urban areas increases the risk of major impacts by extreme extreme droughts among others.
The foregoing coincides with that evidenced in regions such as the Mediterranean basin where the impact of water resources is expected [33], in North Africa [34], southern Mediterranean [35]. In addition to decreases in water supply, several studies project a sharp increase in water demand due to population growth and economic development, indicating increased water stress in the future [36]. Climate model simulations converge towards a decrease in precipitation in summer and, to a lesser extent, in winter, which is responsible for the decrease in surface runoff and groundwater recharge. As a consequence of the decrease in surface runoff, a significant decrease in the supply of water to dams, reservoirs and low groundwater recharge is expected, which are used mainly for irrigation. Several studies in other regions of the world show that in many cases the decrease in groundwater recharge is the result of the reduction of surface runoff [37,38]; since in semi-arid environments, the targeted infiltration of rivers is the main groundwater recharge process. It has been reported that the drop in groundwater levels due to overexploitation and degradation of water quality in aquifers. The main cause in Los Altos is the intense pumping of groundwater in agricultural activities, together with the demand from urban areas with high population densities. This shows that at the current rate of extraction, groundwater cannot be considered a long-term resource, given the greater variability of rainfall due to climate change. Thus, based on the foregoing, this region was identified together with the northern region of the state of Jalisco as one of the regions with the greatest vulnerability to the decrease in surface and groundwater resources.
Conclusion
As predicted by the IPCC (2007) for global estimates of water availability by the middle of the century, a 10-30% decline in freshwater is forecast in dry, tropical areas (Mexico and the state of Jalisco). Some areas are already experiencing water stress; western Mexico is deficient in surface and groundwater. As is known, the increasing water demands are: for irrigation to the South Coast region with demand of more than 800 million m3/a, for livestock in the Altos Norte Region with needs of more than 100 million m3/a, the Guadalajara metropolitan area with the highest demand for water for human settlements with over 100 million m3/a which is not satisfied with water available in the Central Region, which causes water demand from other regions such as Ciénega and Altos Sur. As the century advances, the demands will be increasing, which will lead to greater water stress in the Altos Region and the North Coast, while the largest groundwater deficits will be presented in the Central Region, Altos Norte and Ciénega. It is likely that as the century progresses, with the increase in temperature and decrease in relative humidity and precipitation intensity, the amount of drought-affected areas will increase. Likewise, a decrease in the reserves of stored water is anticipated, which would reduce the availability of water as we approach the end of the century.
- IPCC (2013) Resumen para responsables de políticas. En: Cambio Climático 2013: Bases físicas. Contribución del Grupo de trabajo I al Quinto Informe de Evaluación del Grupo Intergubernamental de Expertos sobre el Cambio Climático [Stocker, T. F., D. Qin, GK Plattner, M. Tignor, S. K. Allen, J. Boschung, A. Nauels, Y. Xia, V. Bex y P.M. Midgley (eds.)]. Cambridge University Press, Cambridge, Reino Unido y Nueva York, NY, Estados Unidos de América. Link: https://bit.ly/2NmCFeB
- Ramírez-Sánchez HU, García-Guadalupe ME, Ulloa-Godínez HH, Meulenert-Peña AR, García-Concepción FO, et al. (2016). Evolución del clima y vulnerabilidad del Estado de Jalisco. En Plan estatal de Cambio Climático (PEACC) del Estado de Jalisco. Zapopan, Jalisco, México: Kerigma Artes Graficas. 53-98.
- Revadekar JV, Kothawale DR, Patwardhan SK (2012) About the observed and future changes in temperature extremes over India. Nat Hazards. 60: 1133-1155. Link: https://bit.ly/3rRd90d
- Easterling DR, Meehl GA, Parmesan C, Changnon SA, Karl TR, et al. (2000) Climate extremes: observations, modelling and impacts. Science 289:2068-2074. Link: http://bit.ly/2QcB8sR
- Meehl GA, Zwiers F, Evans J, Knutson TT, Mearns L, et al. (2000a) Trends in extreme weather and climate events: issues related to modeling extremes in projections of future climate change. Bull Am Meteorol Soc. 81: 427-436. Link: https://bit.ly/2OXkNYa
- Meehl GA, Karl T, Easterling DR, Changnon S, Pielke R, et al. (2000b) An introduction to trends in extreme weather and climate events: observations, socioeconomic impacts, terrestrial ecological impacts, and model projections. Bull Am Meteorol Soc 81: 413-416. Link: https://bit.ly/3tsohRg
- Walther GR, Post E, Convey P, Menzel A, Parmesan C, et al. (2002) Ecological responses to recent climate change. Nature 416: 389-395. Link: https://go.nature.com/3cF0K8W
- Calanca P, Roesch A, Jasper K, Wild M (2006) Global warming and the summertime evapotranspiration regime of the Alpine region, Clim. Change, 79: 65-78. Link: https://bit.ly/3eItP6n
- Scibek J, Allen DM (2006) Modeled impacts of predicted climate change on recharge and groundwater levels, Water Resour. Res. 42. Link: https://bit.ly/3eJPZ8k
- Caballero Y, Voirin‐Morel S, Habets F, Noilhan J, LeMoigne P, et al. (2007) Hydrological sensitivity of the Adour‐Garonne river basin to climate change, Water Resour. Res. 43. Link: https://bit.ly/3cAtL5J
- Fu G, Charles SP, Viney NR, Chen SL, Wu JQ (2007) Impacts of climate variability on stream‐flow in Yellow River, Hydrol. Processes. 21: 3431-3439. Link: https://bit.ly/3bN2v4W
- Jyrkama MI, Sykes JF (2007) The impact of climate change on spatially varying groundwater recharge in the Grand River watershed (Ontario), J. Hydrol. 338: 237-250. Link: http://bit.ly/30KR6vZ
- Thomas DSG, Twyman C, Osbahr H (2007) Adaptation to climate change and variability: Farmer responses to intra‐seasonal precipitation trends in South Africa, Clim. Change. 83: 301-322. Link: https://bit.ly/2OVIe4j
- Serrat-Capdevila A, Valdes JB, Perez JG, Baird K, Mata LJ, et al. (2007) Modeling climate change impacts—and uncertainty—on the hydrology of a riparian system: The San Pedro Basin (Arizona/Sonora), J Hydrol. 347: 48-66. Link: https://bit.ly/38JNH5e
- Cuo L, Lettenmaier DP, Alberti M, Richey JE (2009) Effects of a century of land cover and climate change on the hydrology of the Puget Sound basin, Hydrol Processes. 23: 907-933. Link: https://bit.ly/3cyFbHj
- Kundzewicz ZW, Mata LJ, Arnell NW, Doll P, Jimenez B, et al. (2008) The implications of projected climate change for freshwater resources and their management. Hydrol Sci J. 53: 3-10. Link: https://bit.ly/3liR8F5
- Vörösmarty CJ (2000) Global water resources: vulnerability from climate change and population growth. Science 289: 284-288. Link: http://bit.ly/3qRrpVk
- Tebaldi C, Knutti R (2007) The use of the multi-model ensemble in probabilistic climate projections. Phil Trans R Soc A. 365: 2053-2075. Link: https://bit.ly/30MAcx5
- Meehl GA, Covey C, Delworth T, Latif M, McAvaney B, et al. (2007) The WCRP CMIP3 multimodel dataset. Bull. Am. Meteorol Soc. 88: 1383-1394. Link: https://bit.ly/3qP9i2o
- Knutti R (2008) Should we believe model predictions of future climate change? Phil Trans R Soc A. 366: 4647-4664. Link: https://bit.ly/3cBI61R
- Fai F, Ana L, Mark N (2011) Water availability in +2°C and +4°C worlds Phil Trans R Soc A. 369: 99-116. Link: https://bit.ly/3qS6rpt
- IPCC (2000) Special Report on Emissions Scenarios, SRES, IPCC, 2000. A Special Report of Working Group III of the Intergovernmental Panel on Climate Change. Nebojs˘a Nakic´enovic´, Ogunlade Davidson, Gerald Davis, Arnulf Grübler, Tom Kram, Emilio Lebre La Rovere, Bert Metz, Tsuneyuki Morita, William Pepper, Hugh Pitcher, Alexei Sankovski, Priyadarshi Shukla, Robert Swart, Robert Watson, Zhou Dadi. Link: https://bit.ly/3qSDoSo
- IPCC (2013) Annex I: Atlas of global and regional climate projections. In: Stocker TF, D. Qin, G.-K. Plattner, M. Tignor, S.K. Allen, J. Boschung, A. Nauels, Y. Xia, V. Bex and P.M. Midgley (eds) Climate change 2013: The physical science basis. Contribution of Working Group I to the Fifth Assessment Report of the Intergovernmental Panel on Climate Change. Cambridge University Press, Cambridge. 1311–1310.
- SMN (2019) Normales climatológicas del Estado de Jalisco por estación. https://smn.conagua.gob.mx/es/climatologia/informacion-climatologica/normales-climatologicas-por estado. Fecha de consulta 30 de mayo de 2019.
- Zhang X, Yang F (2004) RClimDex (1.0) Manual del Usuario. Climate Research Branch Environment Canada Downsview, Ontario Canada. Link: http://bit.ly/3tCgq43
- Peterson TC (2005) Climate Change Indices. WMO Bulletin. 54: 83-86. Link: http://bit.ly/391NPgH
- Donat MG, Peterson TC, Brunet M, King AD, Almazroui M, et al. (2013) Changes in extreme temperature and precipitation in the Arab region: long-term trends and variability related to ENSO and NAO. Int J Climatol 34: 581–592. Link: https://bit.ly/3qXPnhS
- Schilling J, Hertig E, Tramblay Y, Scheffran J (2020) Climate change vulnerability, water resources and socialimplications in North Africa. Reg Environ Chang. 20: 1-12. Link: https://bit.ly/3cBM1Mb
- Nouaceur Z, Murărescu O (2016) Rainfall variability and trend analysis of annual rainfall in North Africa. J Atmos Sci. 2016: 1-12. Link: http://bit.ly/3qSjkzu
- Collins M, Knutti R, Arblaster J, Dufresne J-L, Fichefet T, et al. (2013) Long-term climate change: pro- jections, commitments and irreversibility. In: Stocker TF, D. Qin, G.-K. Plattner, M. Tignor, S.K. Allen, J. Boschung, A. Nauels, Y. Xia, V. Bex and P.M. Midgley (eds) Climate change 2013: the phys- ical science basis. Contribution of Working Group I to the Fifth Assessment Report of the Intergovernmental Panel on Climate Change. Cambridge University Press, Cambridge. 1029-1136.
- Christensen JH, Krishna Kumar K, Aldrian E, An S-I, Cavalcanti IFA, et al. (2013) Climate phenomena and their relevance for future regional climate change. In: Stocker TF, D. Qin, G.-K. Plattner, M. Tignor, S.K. Allen, J. Boschung, A. Nauels, Y. Xia, V. Bex and P.M. Midgley (eds) Climate change 2013: the physical science basis. Contribution of Working Group I to the Fifth Assessment Report of the Intergovernmental Panel on Climate Change. Cambridge University Press, Cambridge. 1217-1310.
- Polade SD, Gershunov A, Cayan DR, Dettinger MD, Pierce DW (2017) Precipitation in a warming world: assessing projected hydro-climate changes in California and other Mediterranean climate regions. Sci Rep 7:10783. Link: https://go.nature.com/2NqTV2u
- Lionello P, Scarascia L (2018) The relation between climate change in the Mediterranean region and global warming. Reg Environ Chang. 18: 1481-1493. Link: http://bit.ly/38KKpyC
- Tramblay Y, Jarlan L, Hanich L, Somot S (2018) Future scenarios of surface water resources availability in North African dams. Sustain Water Resour Manag. 32: 1291-1306. Link: https://bit.ly/3qTzOrj
- Prudhomme C, Giuntoli I, Robinson EL, Clark DB, Arnell NW, et al. (2014) Hydrological droughts in the 21st century, hotspots and uncertainties from a global multimodel ensemble experiment. Proc Natl Acad Sci. 111: 3262–3267. Link: https://bit.ly/3tpQIiV
- Milano M, Ruelland D, Fernandez S, Dezetter A, Fabre J, et al. (2012) Facing climatic and anthropogenic changes in the Mediterranean basin: what will be the medium-term impact on water stress? Compt Rendus Geosci. 344: 432–440. Link: http://bit.ly/2OYADlv
- Benabdallah S, Mairech H, Hummel FM (2018) Assessing the impacts of climate change on groundwater recharge for the Chiba Basin in Tunisia. In: Calvache ML, Duque C, Pulido-Velazquez D (eds) Groundwater and global change in the western Mediterranean area. Springer International Publishing, Cham. 27-33. Link: https://bit.ly/3qOEv5D
- Meddi M, Boucefiane A (2013) Climate change impact on groundwater in Cheliff-Zahrez basin (Algeria). APCBEE Procedia. 5: 446–450. Link: http://bit.ly/3ctYXU8
Article Alerts
Subscribe to our articles alerts and stay tuned.
 This work is licensed under a Creative Commons Attribution 4.0 International License.

 Save to Mendeley
